Using the BackOffice Statistics
I. Statistics "Summary"
Generate statistics by inspector, client, agent, type of activity, or geographical areas to track your company’s performance.
To access the BackOffice statistics, click “Accessories” from the sidebar and select “Statistics”.
Navigate through the statistics by using the ribbon at the top.
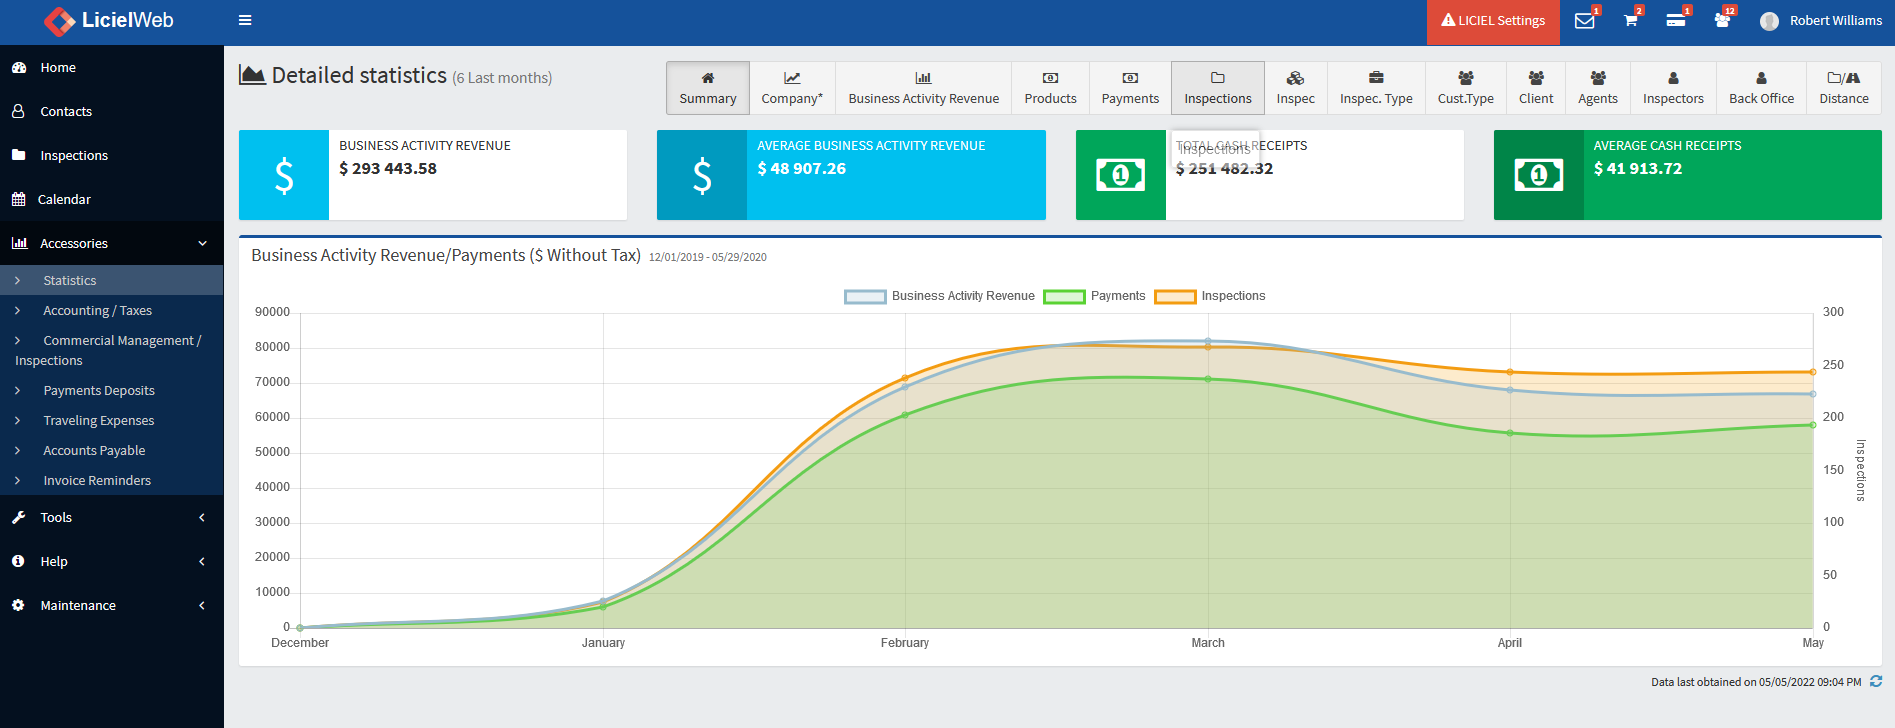
The LICIEL BackOffice uses information regarding your inspection files to display things like business revenue, types of inspections ordered, inspector activity, and more.
The first button in the ribbon, “Summary”, displays the Business Activity Revenue for the last six months.
The boxes at the top display values and averages for the totality of the six months like the total business activity revenue, the monthly average business activity revenue, the total cash receipts, and the monthly average cash receipts.
Each graph is titled appropriately and features a legend at the top.
This graph displays the “Business Activity Revenue / Payments Without Tax”.
The labels on the sides indicate what types of values are displayed.
The categories, in this case the last six months, will be displayed in the bottom.
Hover over any of the plot points to see detailed information.
To view the most updated information click the refresh icon in the bottom right corner.
II. Statistics "Company"
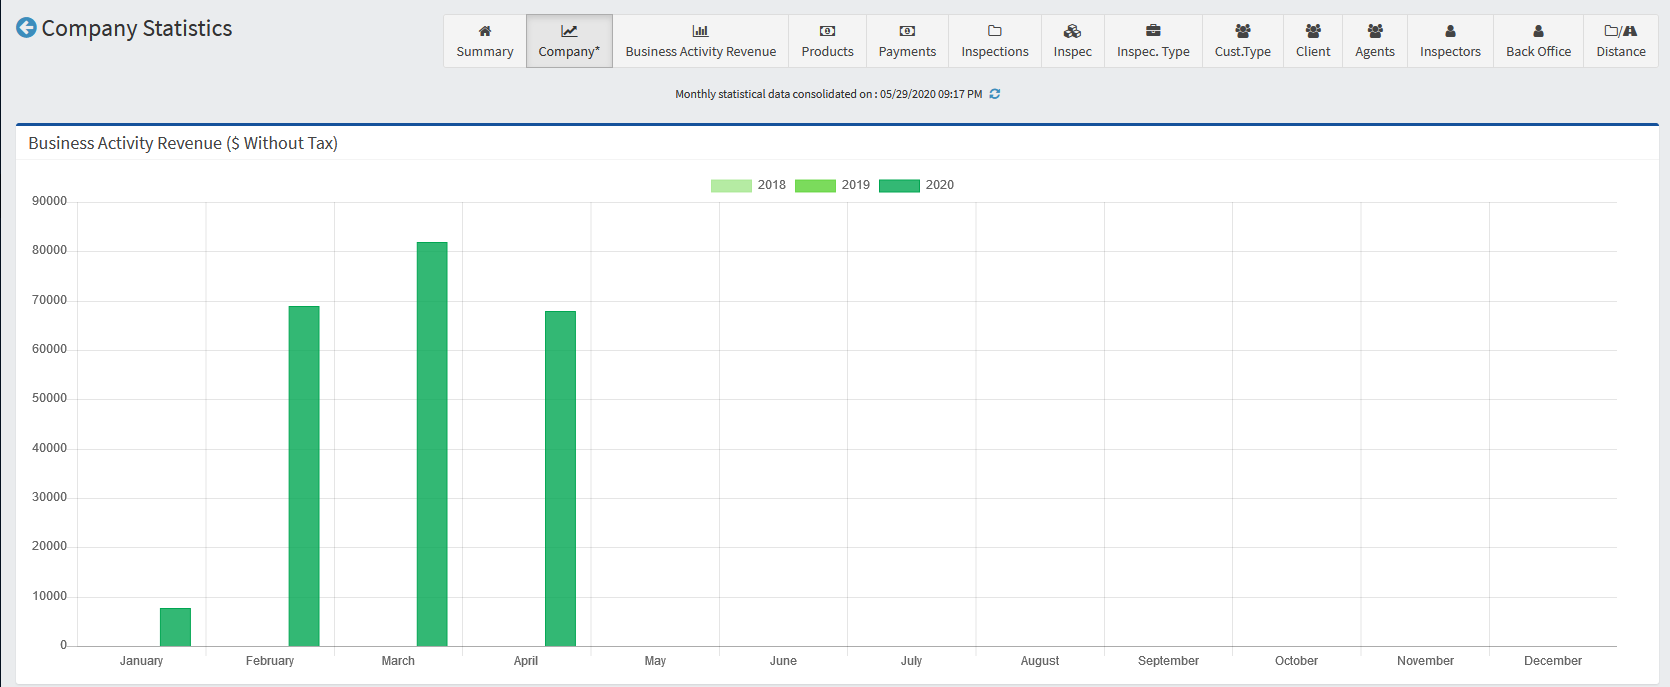
Click the next button in the ribbon, “Company”.
The bar graphs here show information regarding the business activity revenue, the unpaid invoices, the payments received, the number of inspection visits, and the average inspection price.
If you have multiple years of information, you will be able to compare that information here.
Hover over any of the bars in the graphs.
Notice that a tooltip opens to show the exact information for that bar.
III. Statistics "Business Activity Revenue"
The next item in the ribbon, “Business Activity Revenue” displays the “Business Activity Revenue Volume Progress” using a specified date range.
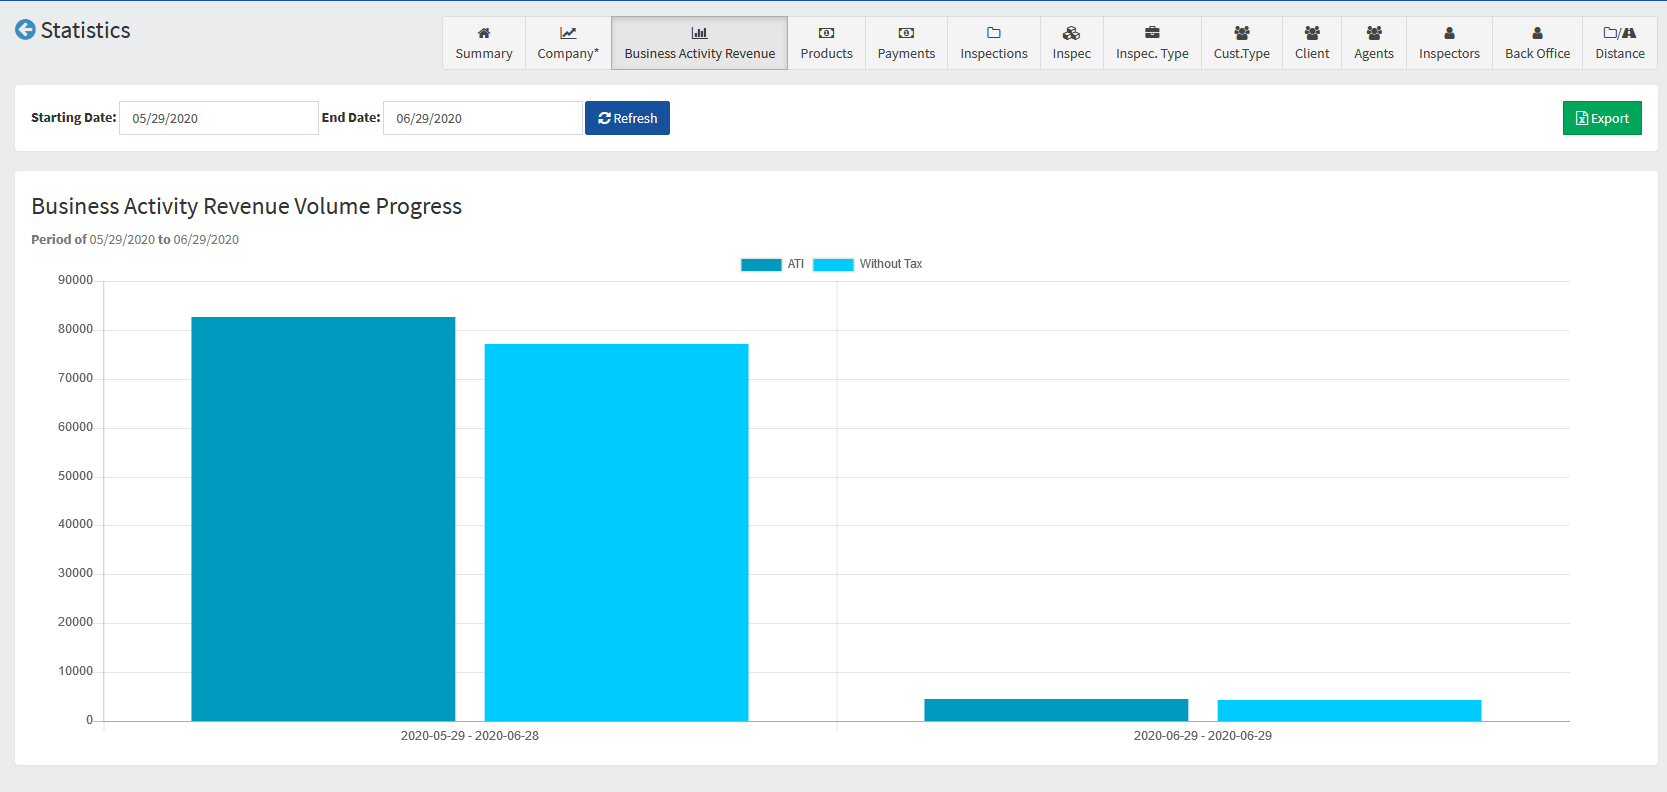
Use the date boxes at the top to select the date range for this graph.
Click the “Refresh” button to update the results using the selected date range.
Notice that the graph shows that date range being displayed.
Click “Export” to download a CSV file with the information in this graph.
IV. Statistics "Products"
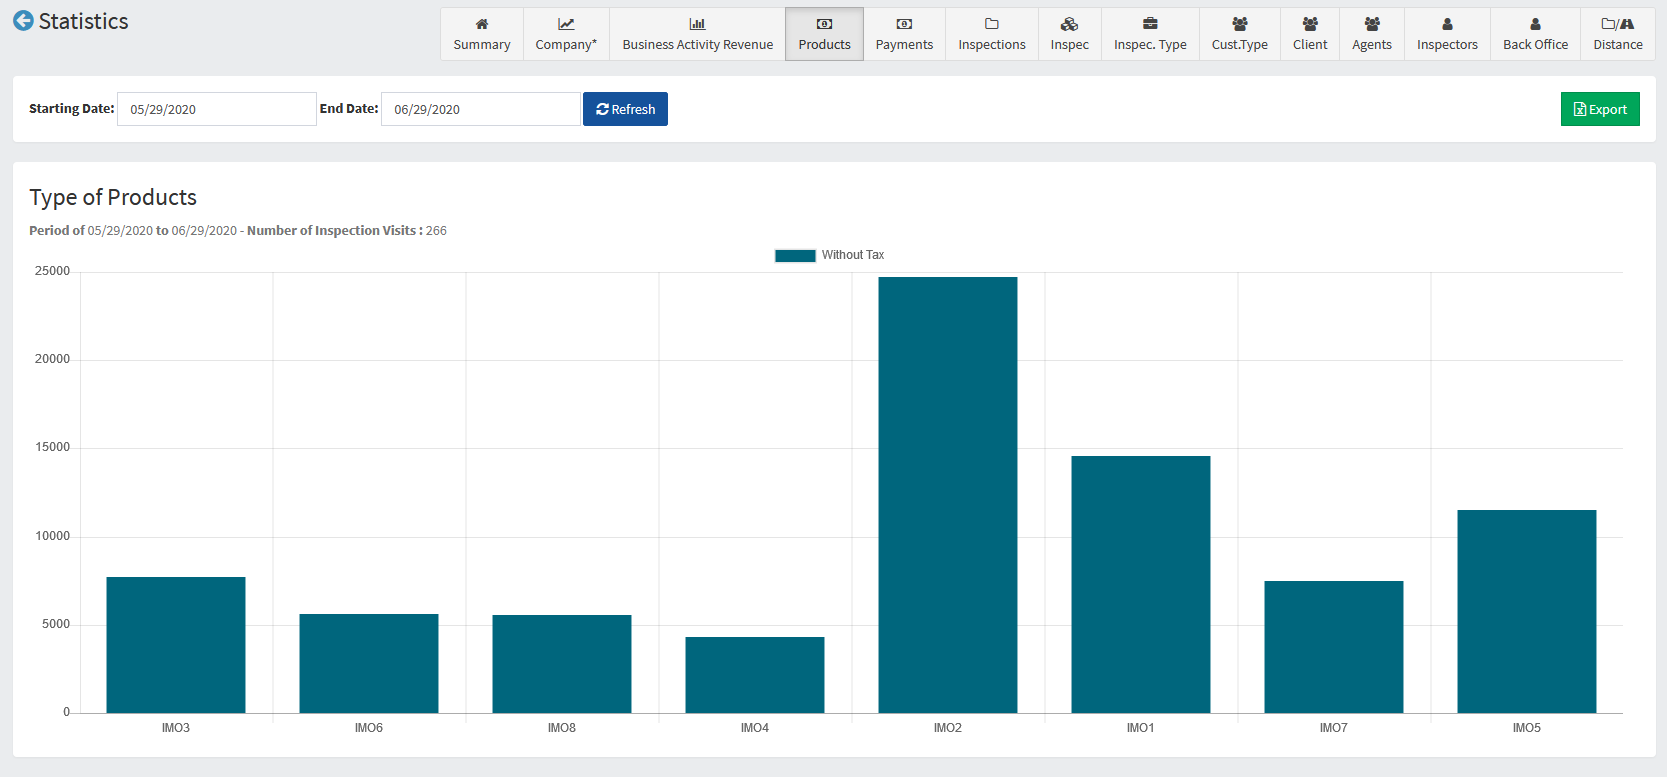
The “Products” graph displays the revenue from the purchased products within a specified date range.
V. Statistics "Payments"
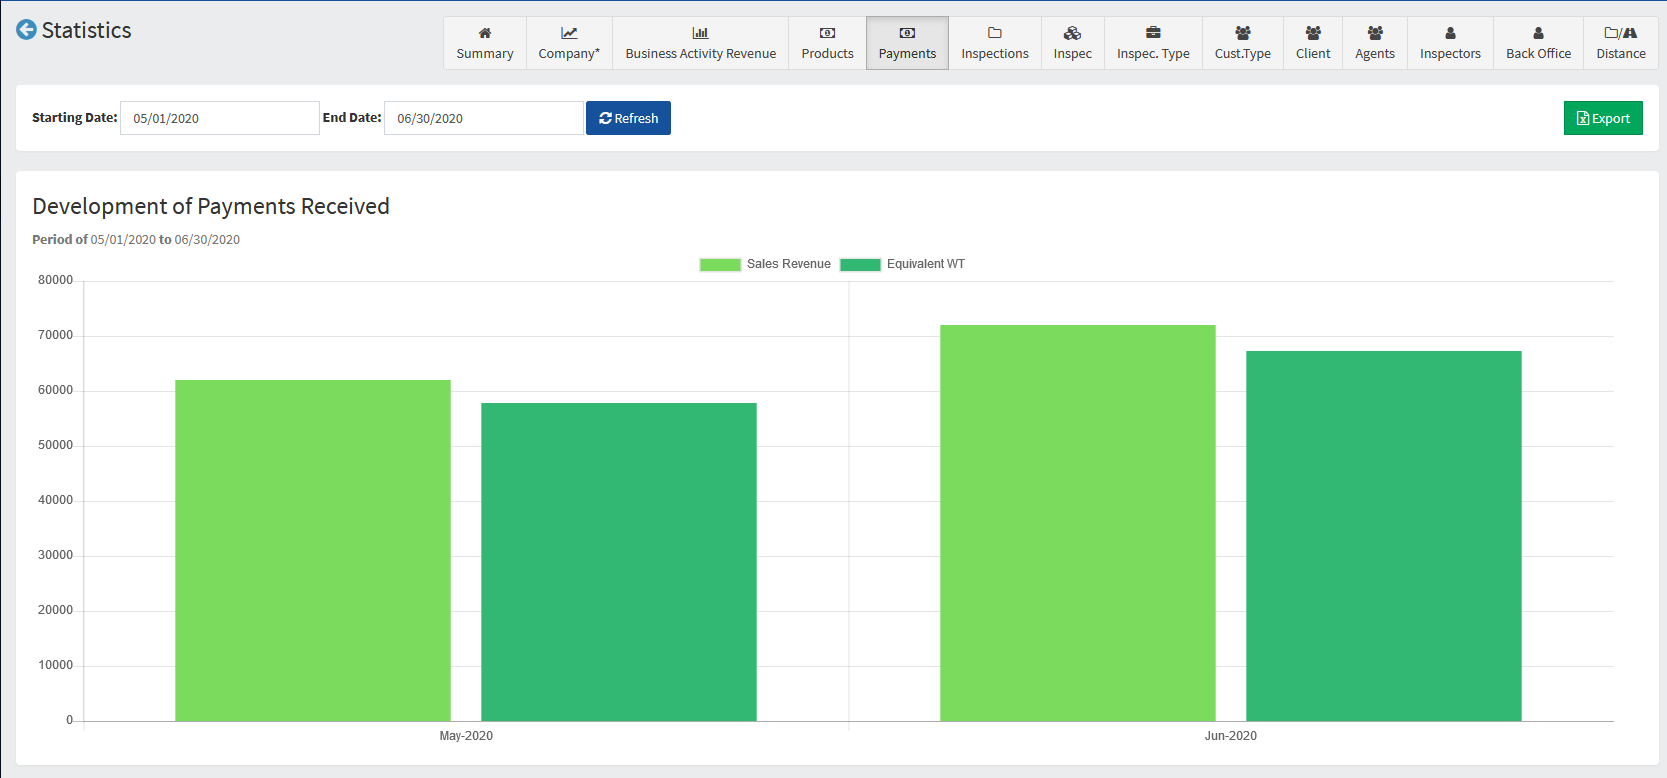
The “Payments” graph displays the “Payments Received” within a specified date range.
VI. Statistics "Inspection Files"
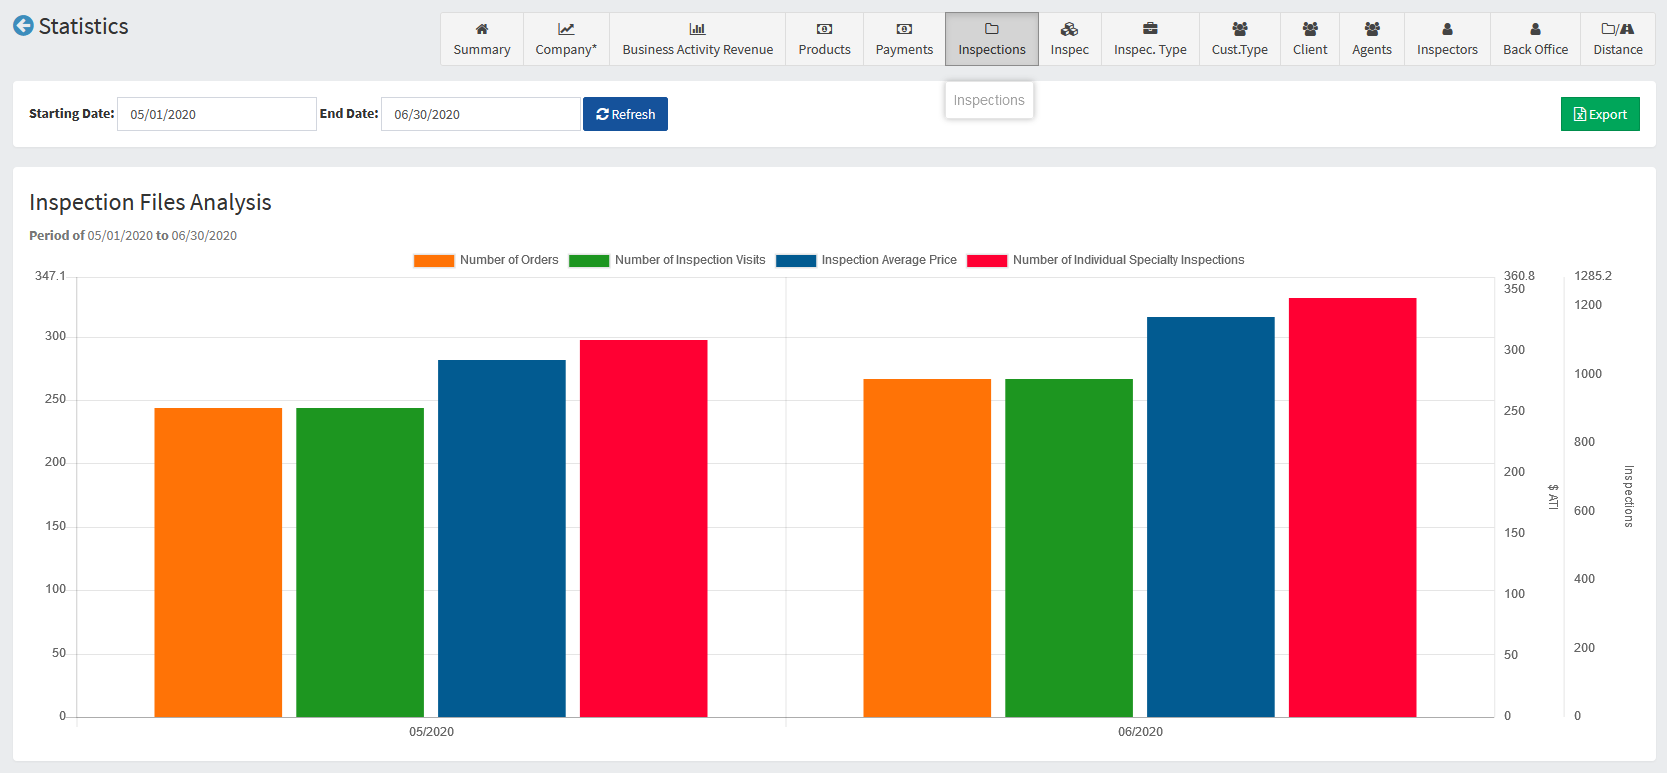
The “Inspection Files” graph displays an Analysis of the Inspection Files including the number of orders and the number of inspection visits.
Select a date range to view the data for that specific time period.

VII. Statistics "Inspections"
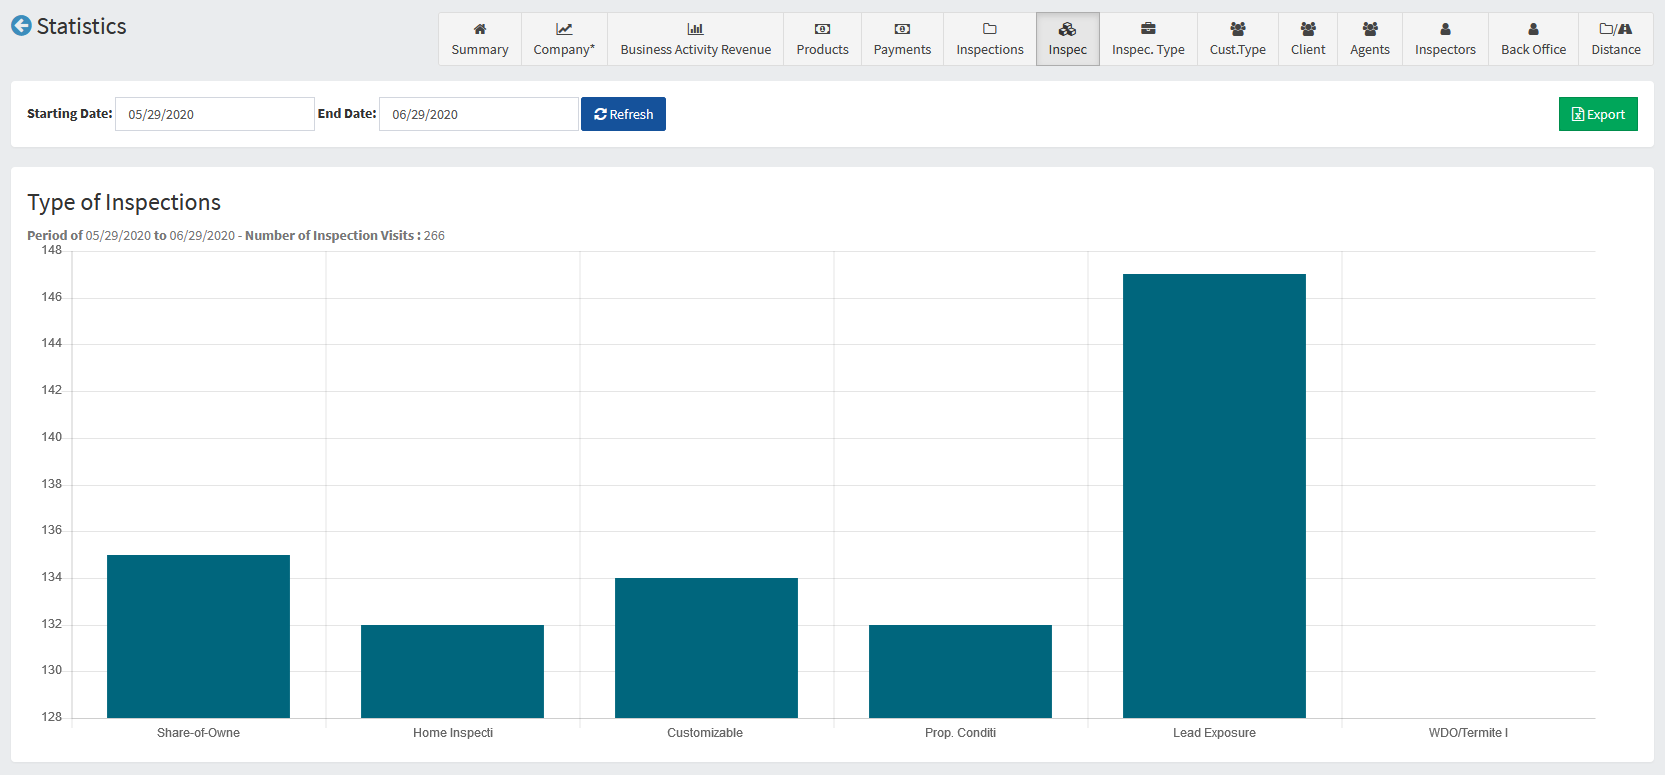
The “Inspections” graph uses a specified date range to display how many times each type of inspection was conducted.
VIII. Statistics "Inspection Type"
From the ribbon, click “Inspection Type” displays the number of inspection visits and the total revenue for your most popular main inspection types.
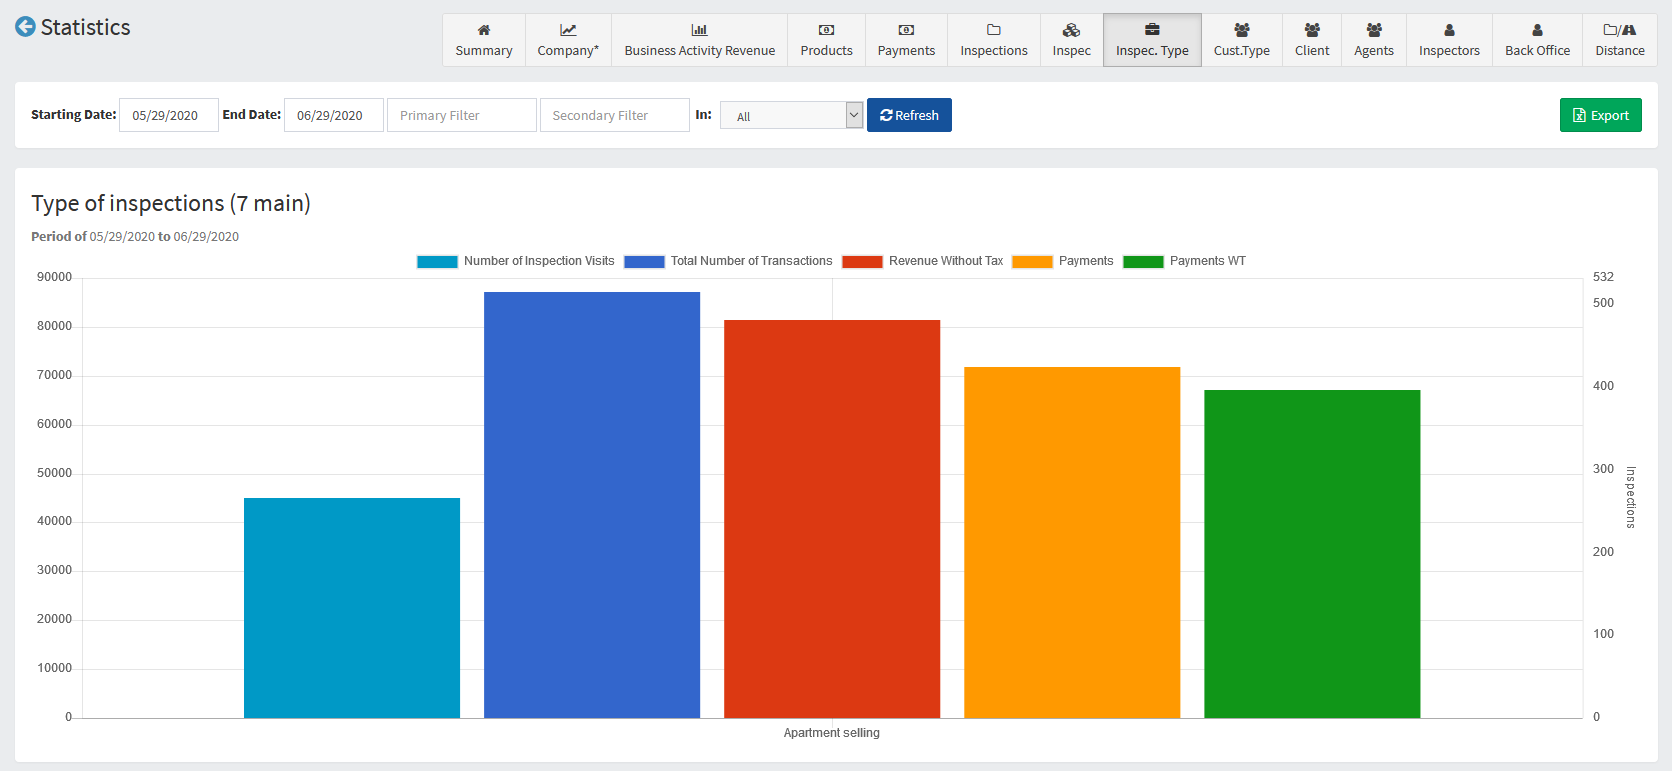
Use the date boxes to select a date range.
If needed, use the filter boxes to filter through the results.
For example, to see the type of inspections linked to a specific real estate agent, enter the agent name in the filter box and then use the drop-down menu to select “Agent”.
Click “Refresh” to update the results.
IX. Statistics "Customer Type"
Continuing through the ribbon, “Customer Type” displays the types of clients.
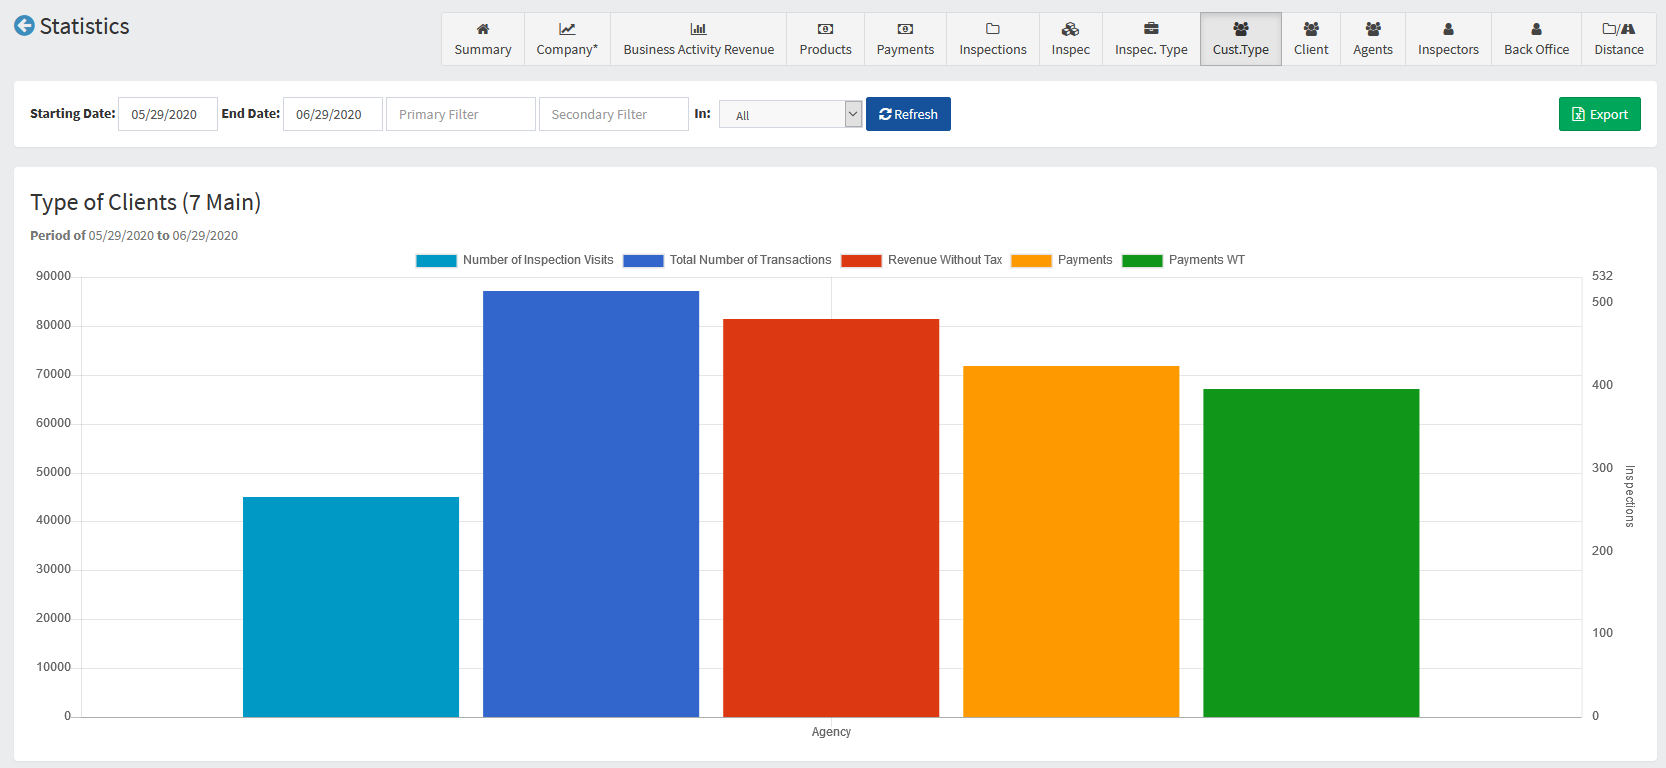
This information is gathered from the information in the inspection files.
Select a date range and if needed enter a filter and click “Refresh” to update the graph.
X. Statistics "Client"
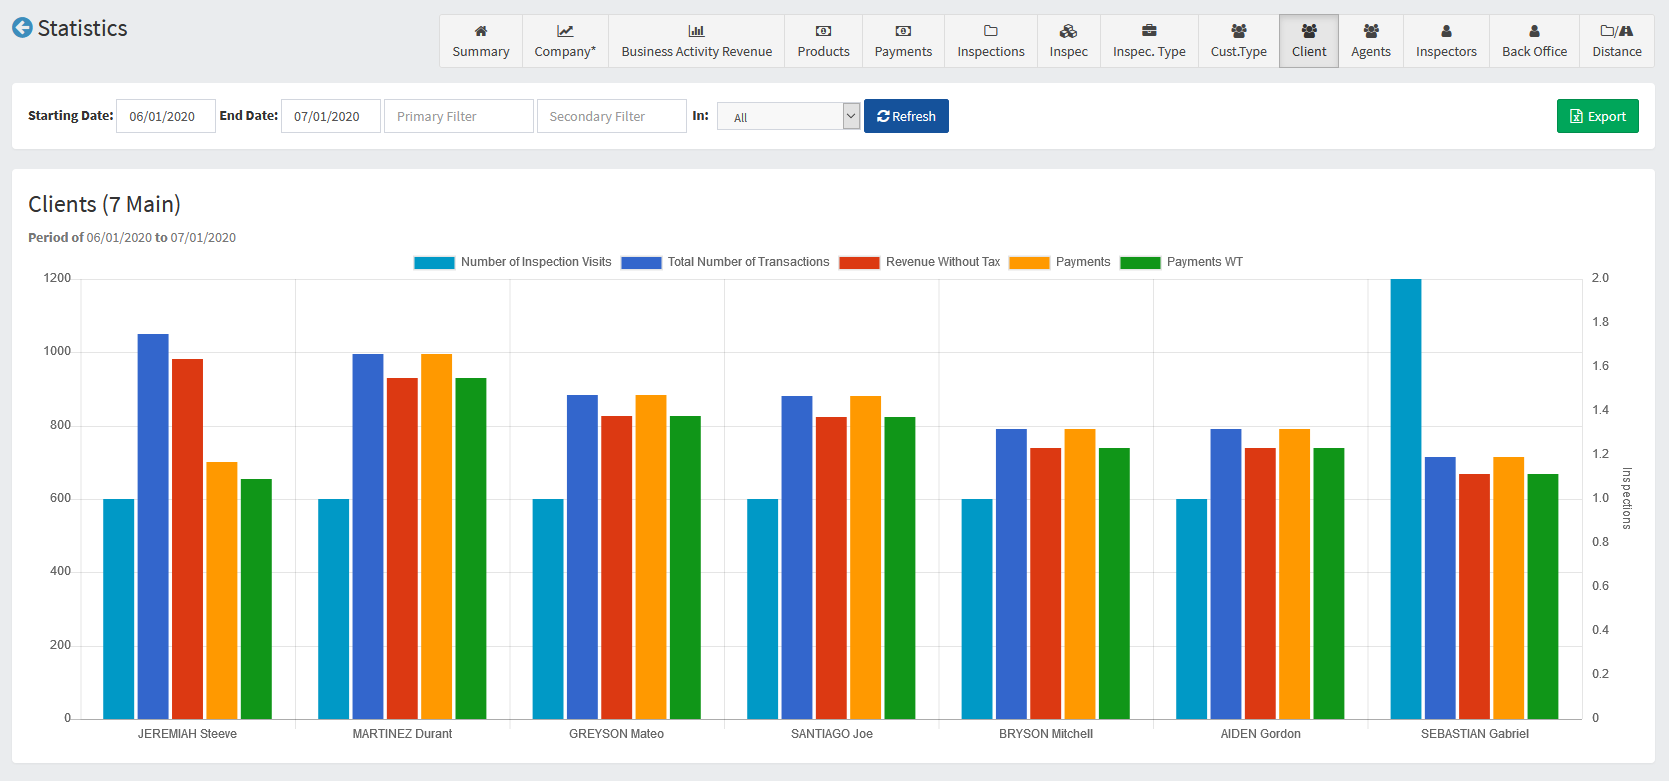
Select “Client” from the ribbon.
Some clients may have multiple properties and therefore multiple inspection files.
This graph will display your top 7 clients using the specified date range.
Again any graph with the “Export” button can be exported for your convenience.
XI. Statistics "Agents"
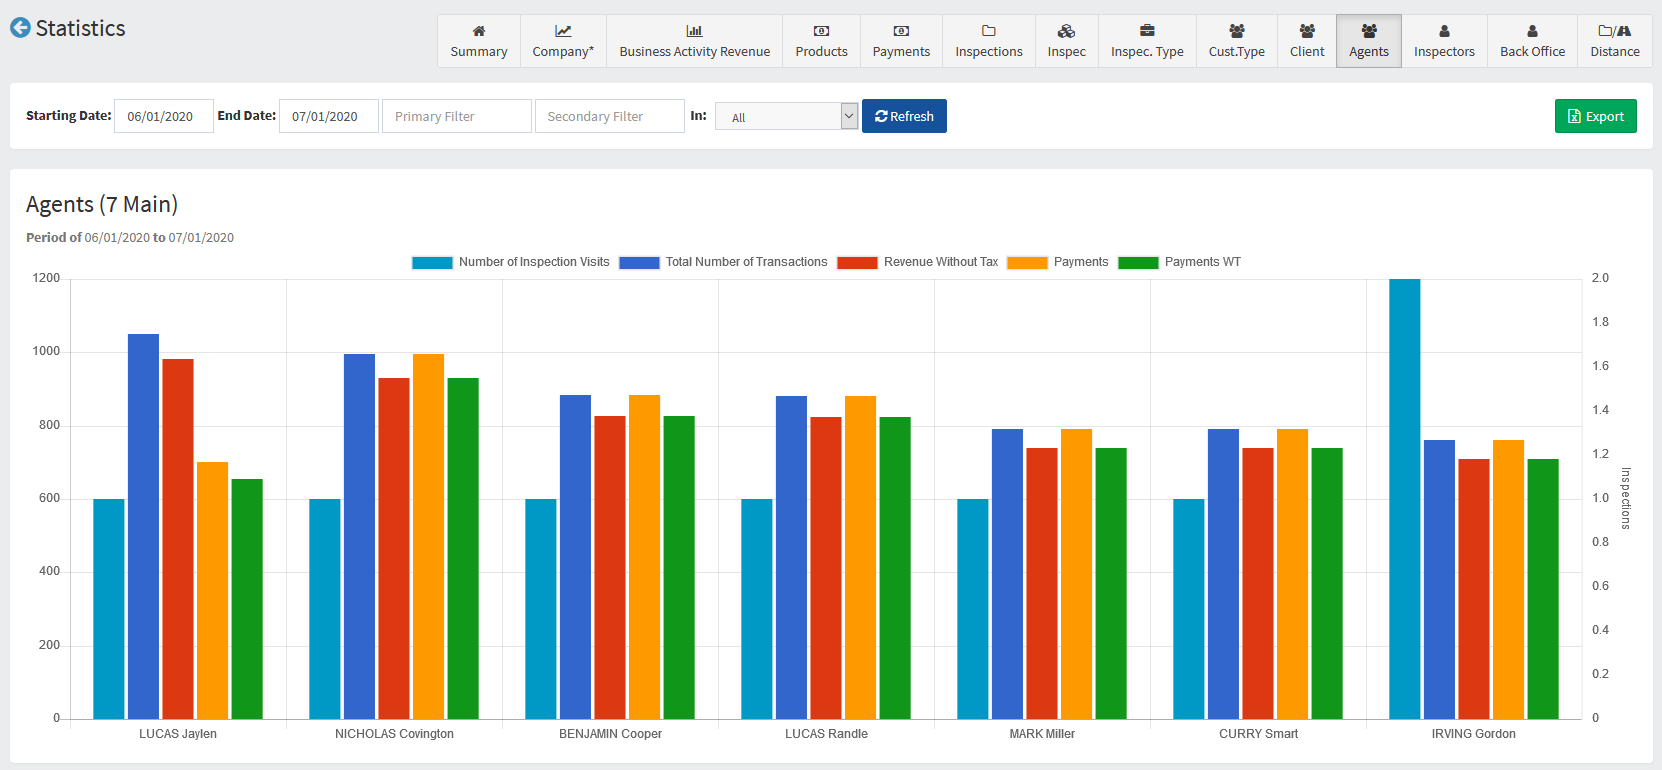
The next graph, “Agents”, displays your 7 main agents for a specified date range.
XII. Statistics "Inspectors"
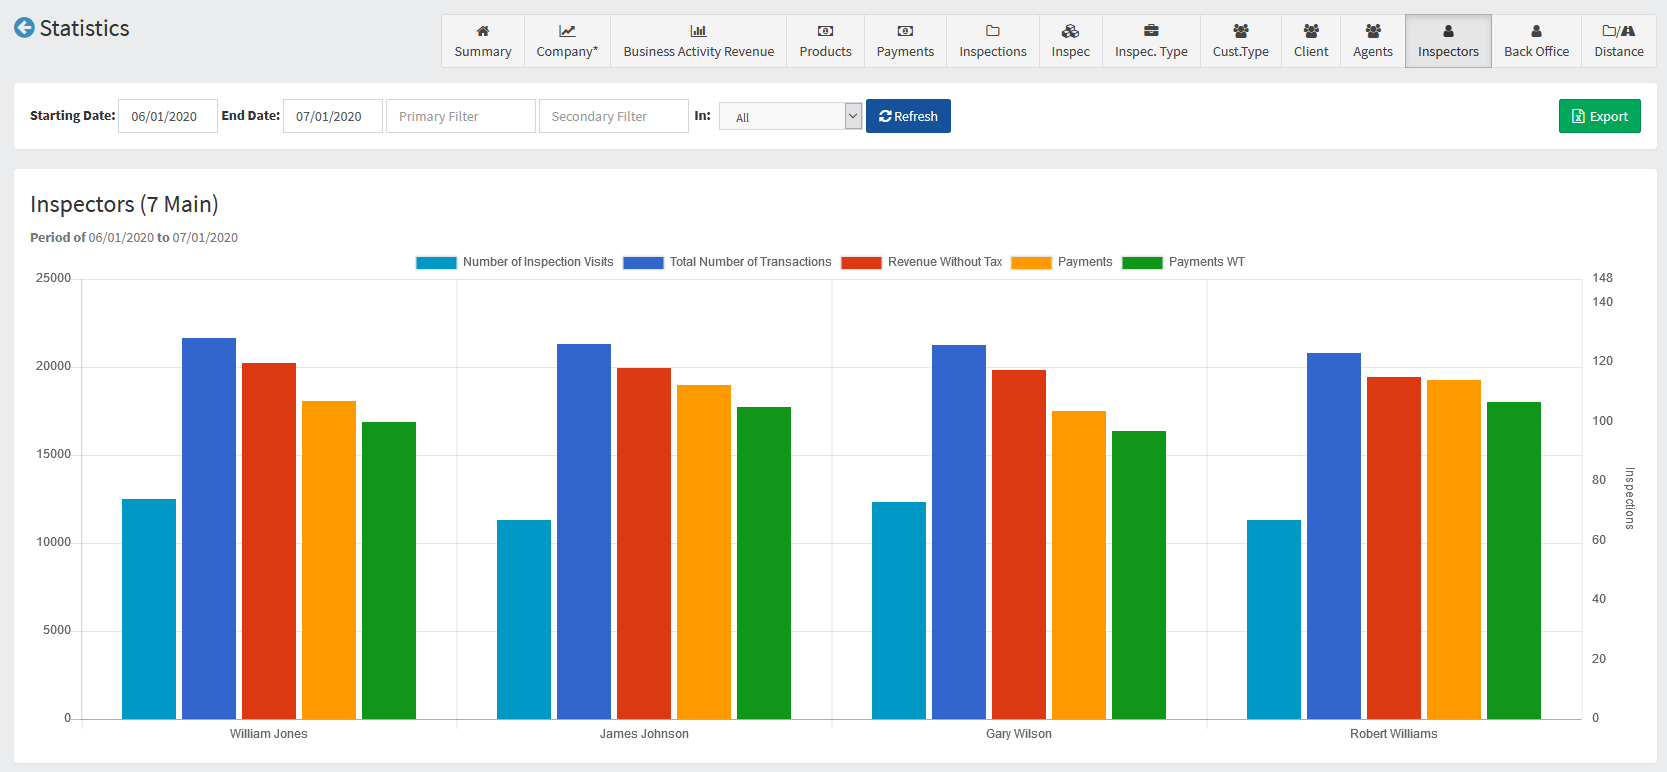
Similarly, the “Inspectors” graph lets you see your top-performing inspectors.
Notice the date range of the date under the title.
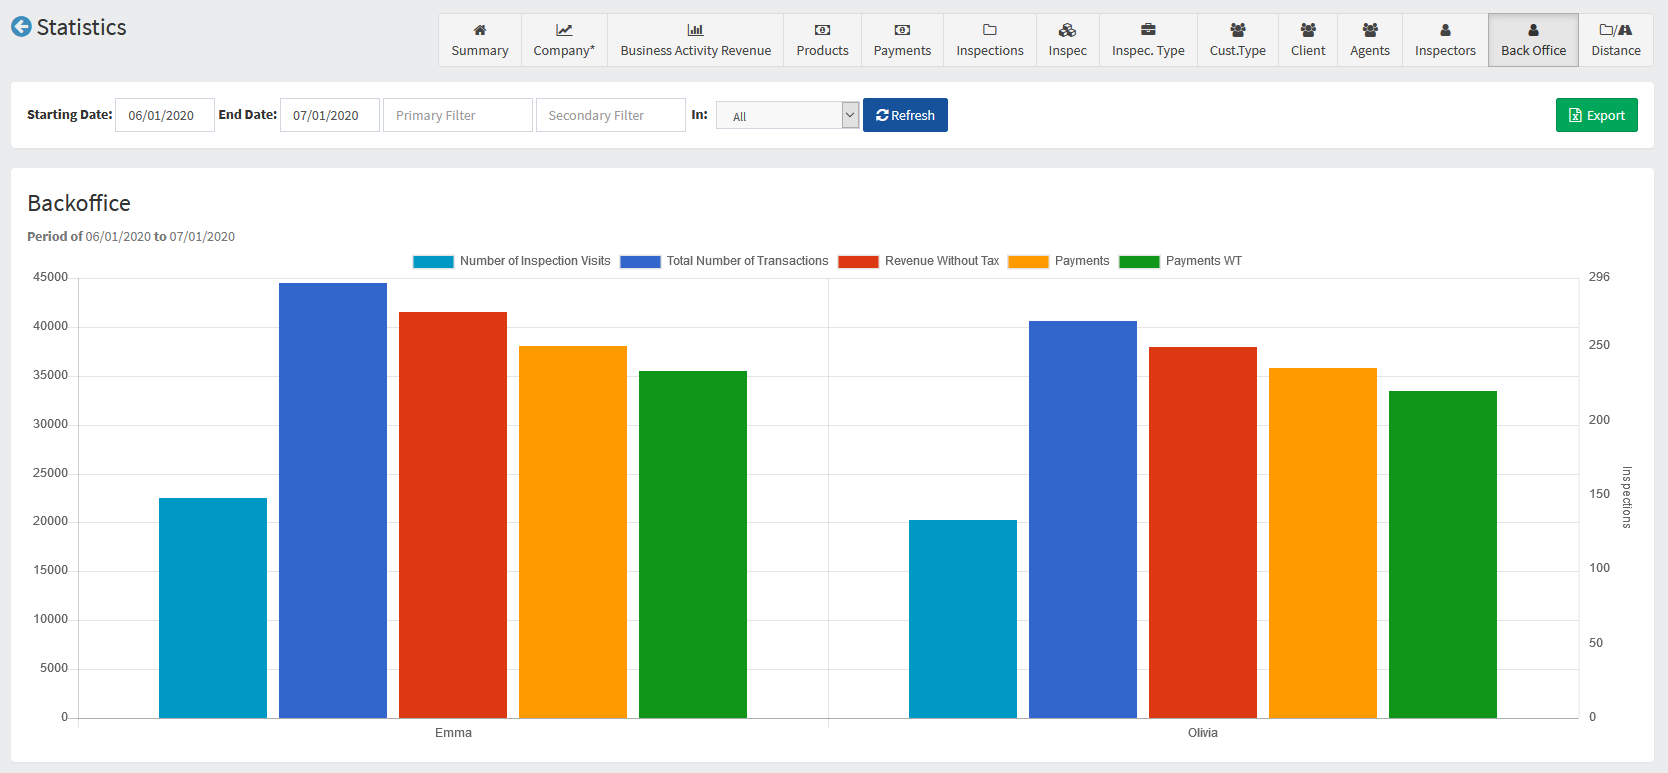
XIII. Statistics "BackOffice"
The “BackOffice” graph displays the inspection file information per BackOffice administrator.
XIV. Statistics "Distance"
Finally, click “Distance” from the ribbon.
The pie chart displays the distance traveled and how many inspections traveled that distance.