Software Contact Management, Statistical Graph Generation, Glossaries, and More
I. Address Book
The software provides an address book so your contacts can be conveniently accessed throughout the software.
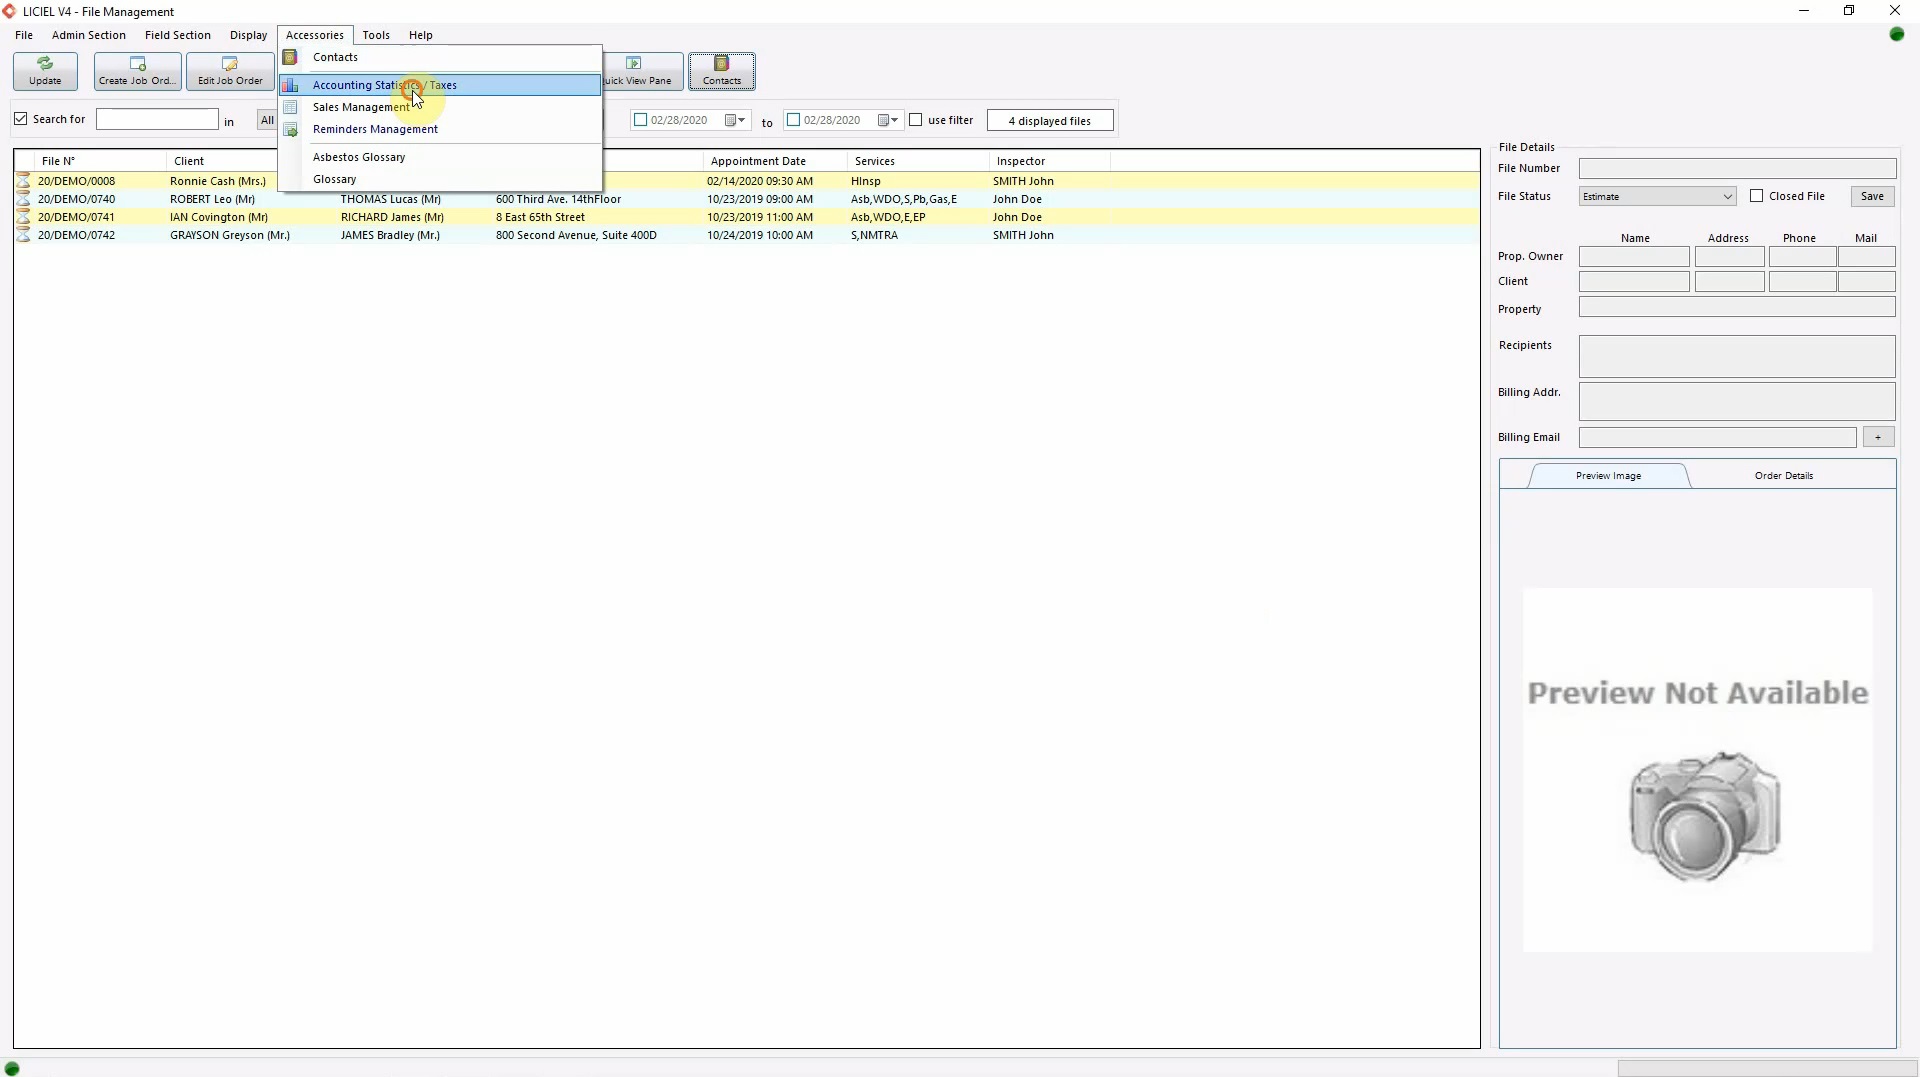
The address book can be access through the tool bar by clicking “Accessories” and selecting “Contacts” from the drop-down.
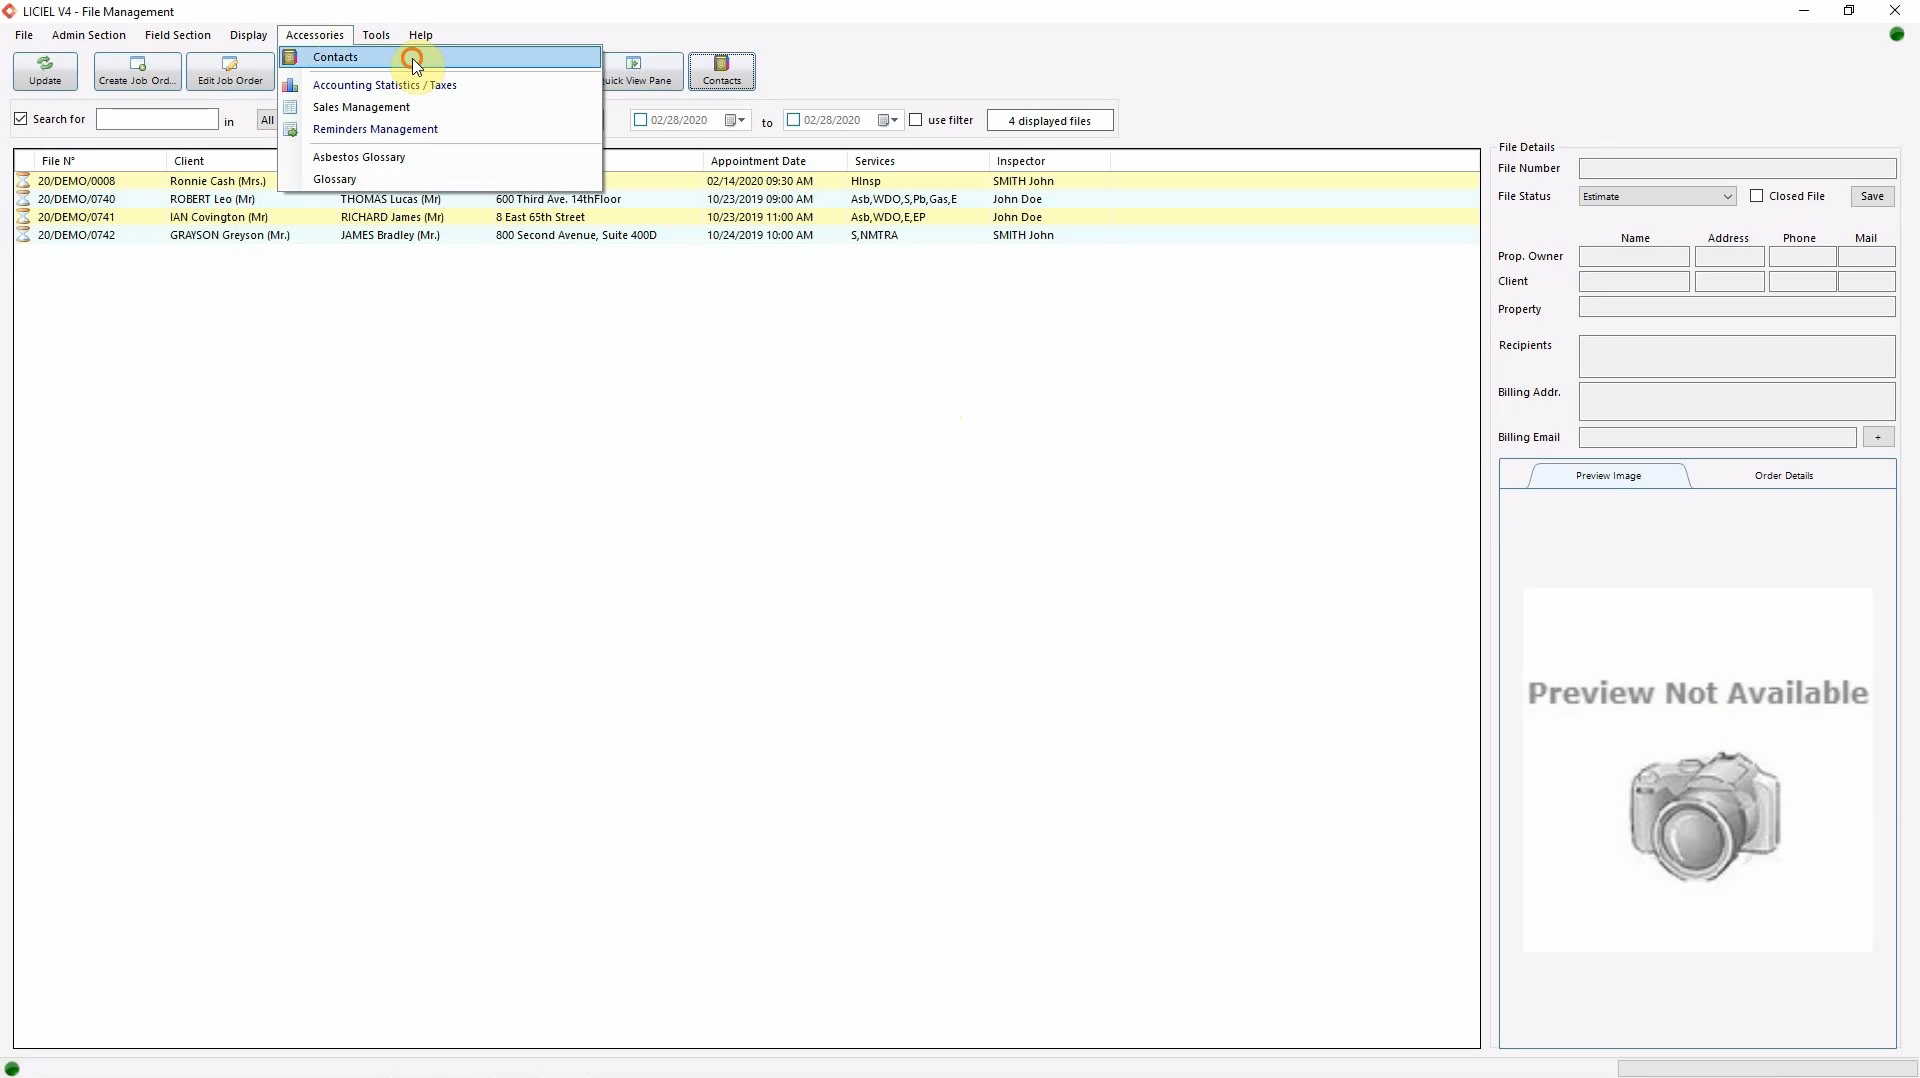
This will open the address book.
Close this window.
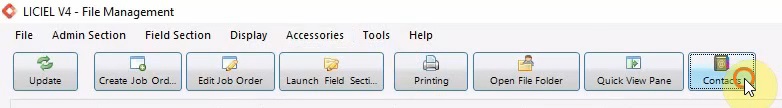
The address book can also be accessed through the ribbon, by clicking the “Contacts” button.
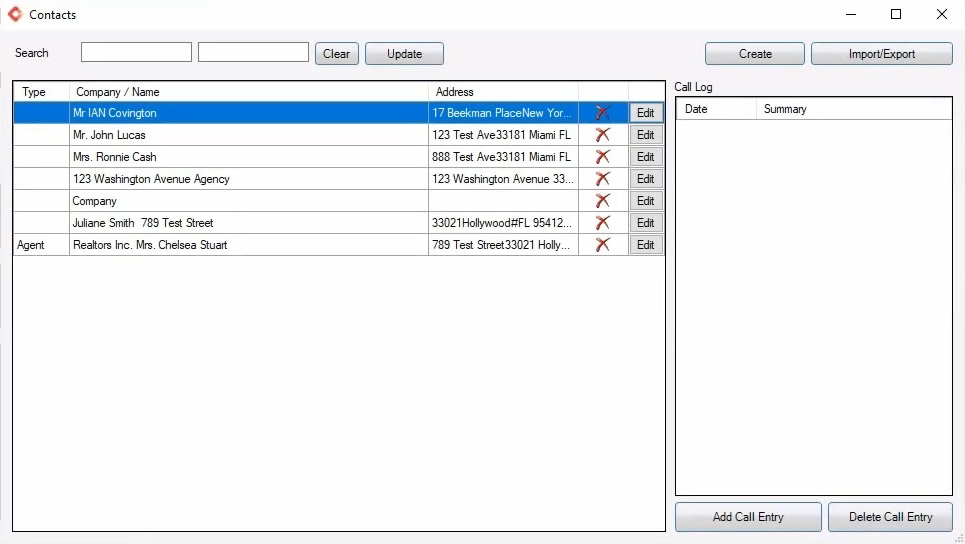
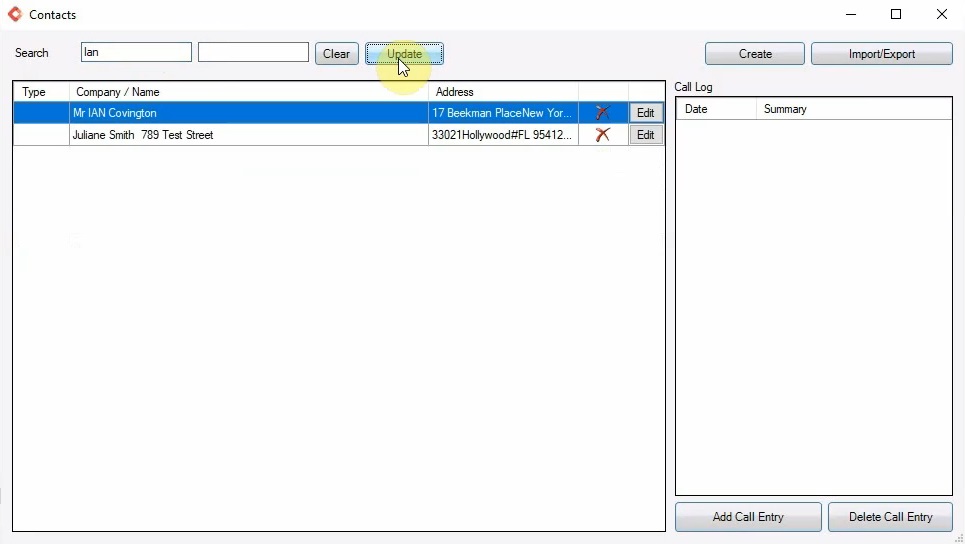
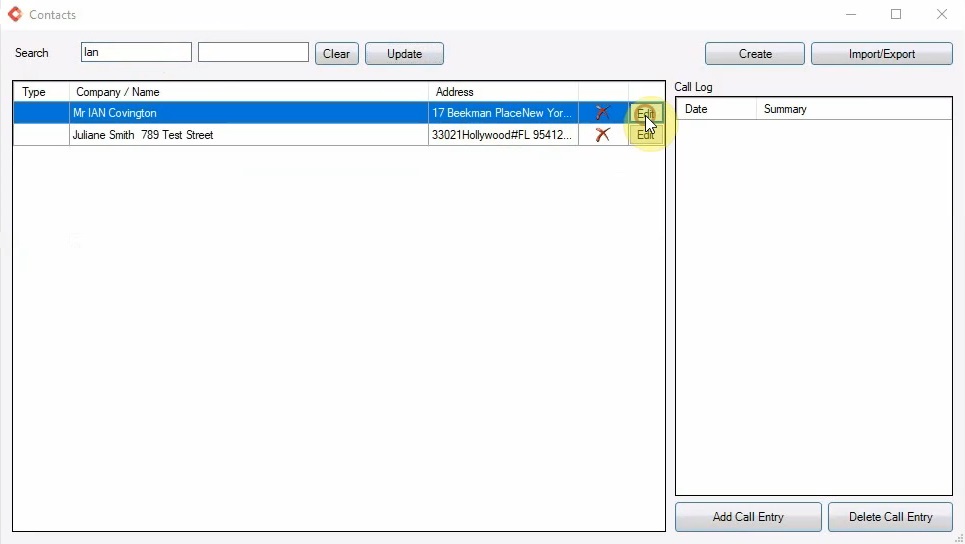
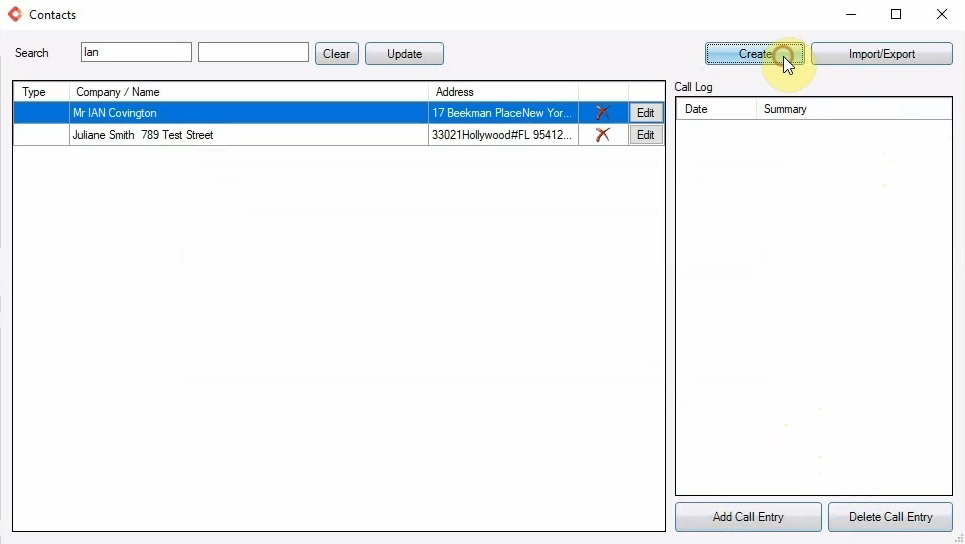
Here you can search through your contacts by using the search box and clicking “Update”.
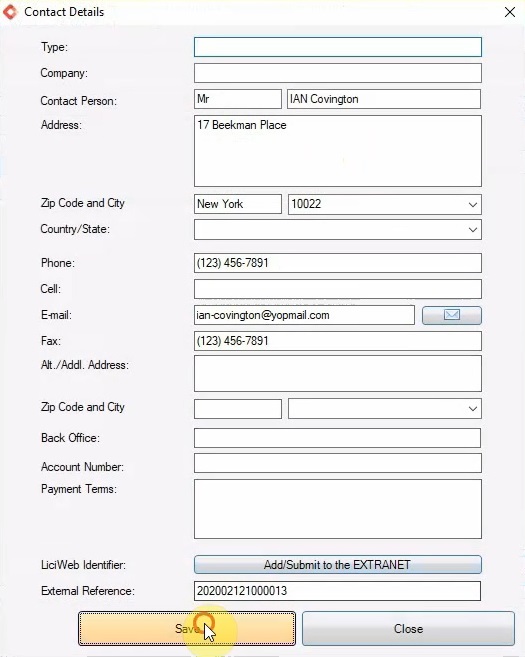
Contacts can be edited by selecting the contact and clicking “Edit”.
Make any necessary changes and click “Save”.
You can track any calls made with the contact by selecting the contact and clicking “Add Call Entry”.
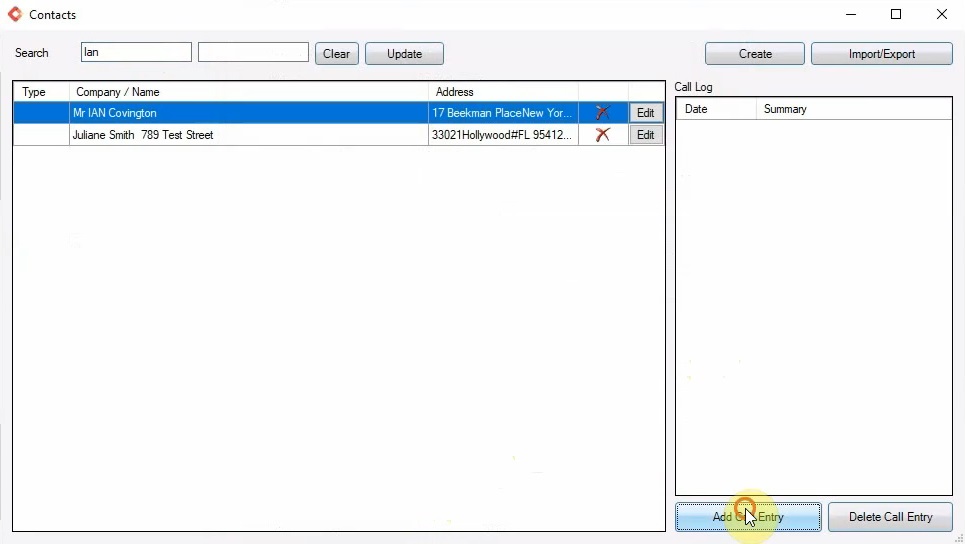
Double click the line that was created in the call log.

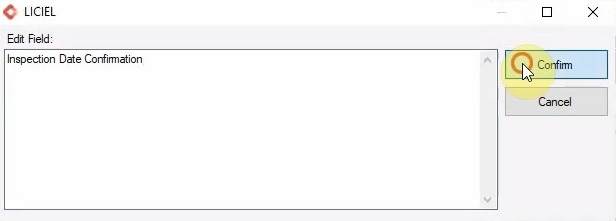
Enter a description of the call and click “Confirm”.
Of course, entries in the call log can be deleted by selecting the call and clicking “Delete Call Entry”.

Finally, create a new contact.
Click “Create”.
Enter the contact details and save when done.
Close the Contacts window.
II. Accounting Statistics
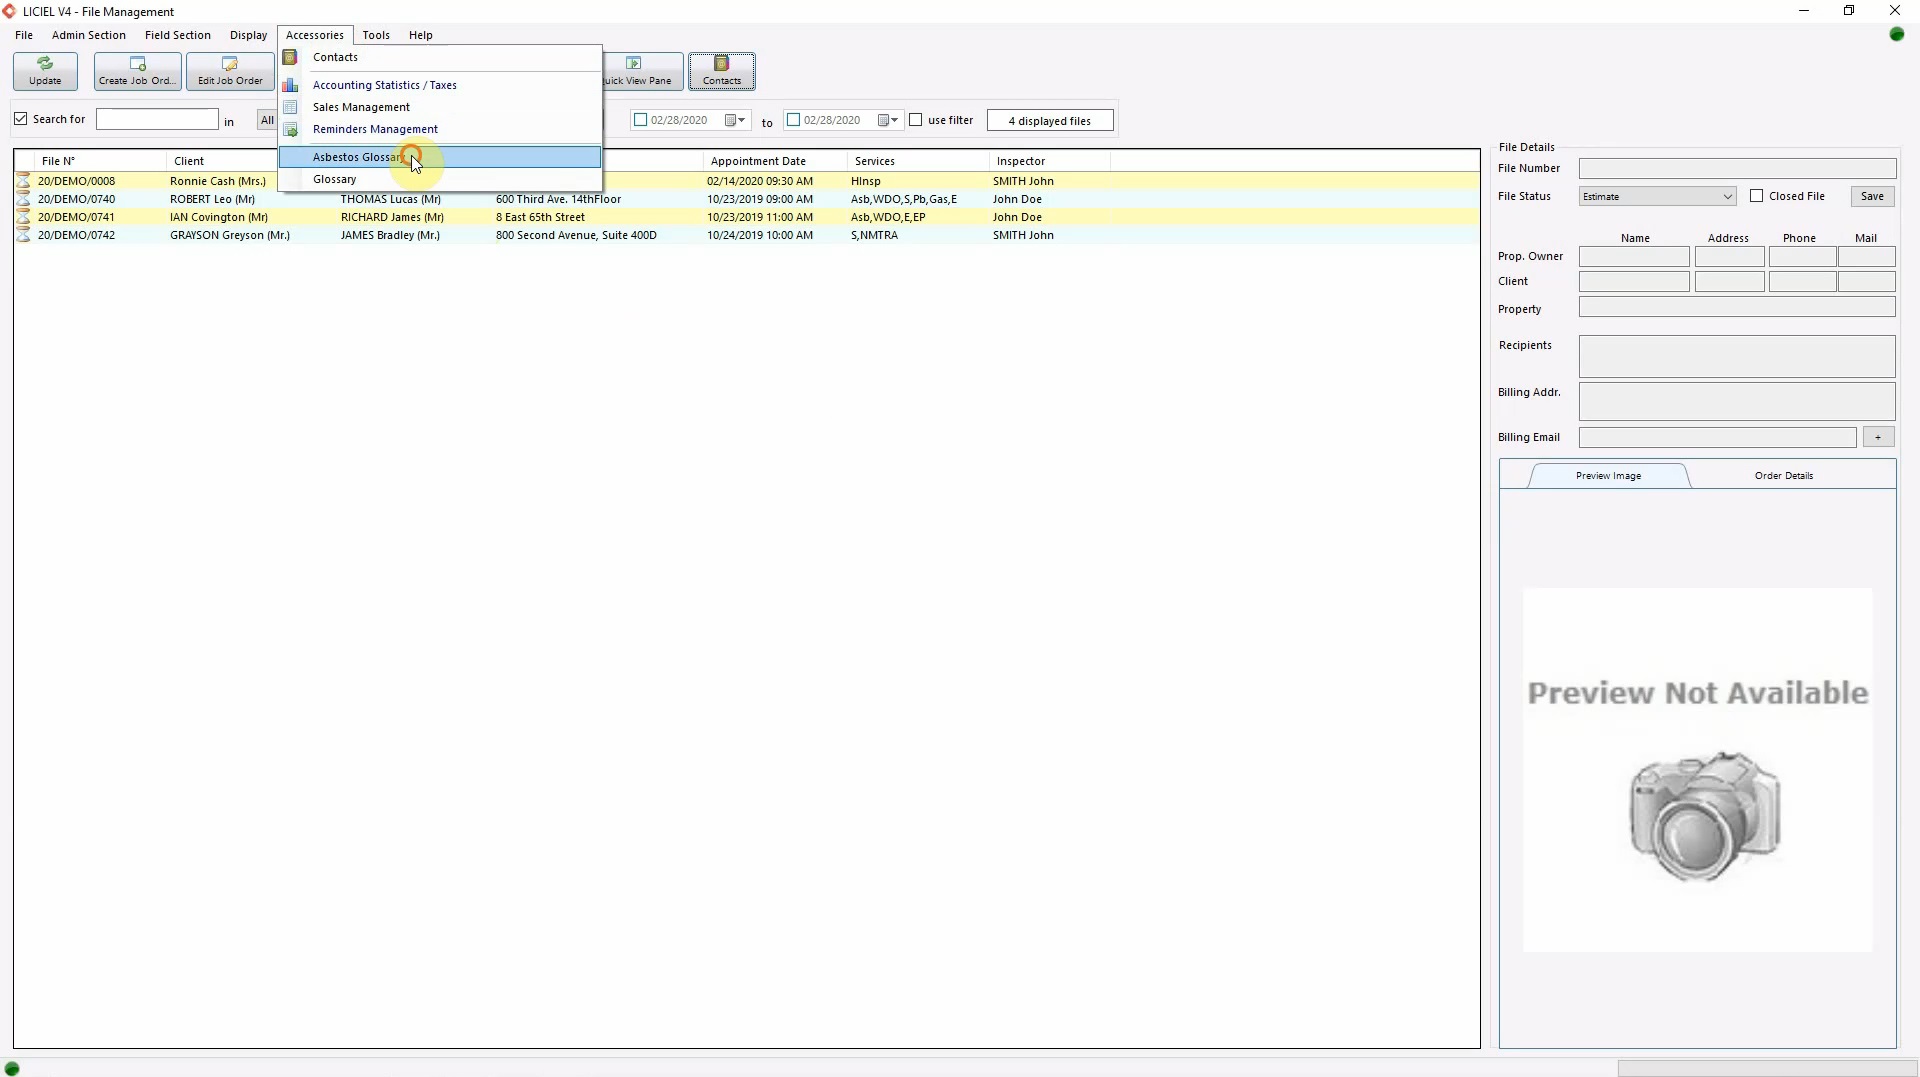
Click “Accessories” from the tool bar and select “Accounting Statistics / Taxes” from the drop down list.
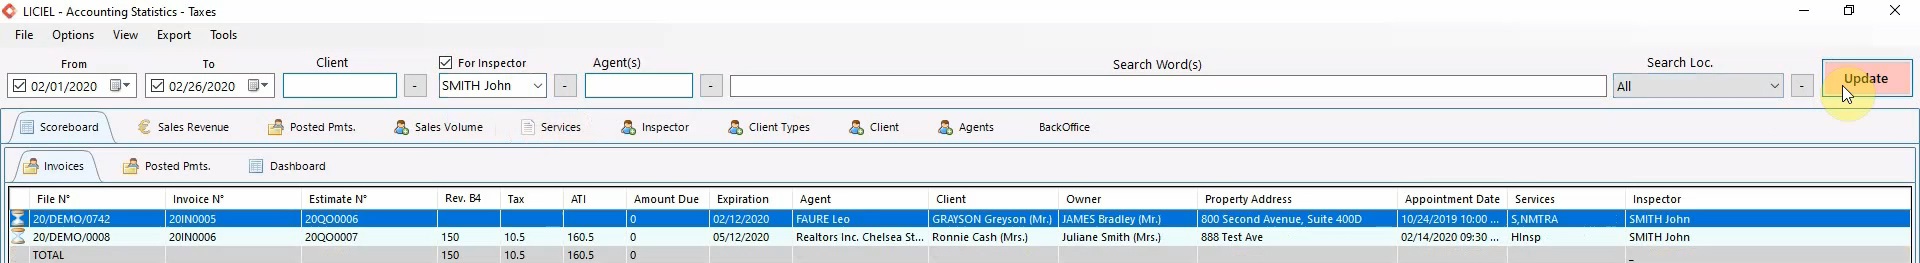
Here you will have access to several important figures like invoices, posted payments, sales revenue progression, top-performing inspectors, and more.
Use the filters at the top to display specific data.
For example, set a data range or use the search box.
You can also display the results for a particular inspector.
From the drop down select an inspector and then check the checkbox “For Inspector”.

Click “Update” to apply the filter.
You can view all the results without a filter by unchecking the checkboxes and by using the small buttons next to each filter to clear that filter.
Click “Update” to apply the changes.
Keep in mind that when a filter is applied, all of the tabs will display the results accordingly.
Use the tabs at the top to navigate through the Accounting Statistics and Taxes window.
Some of these tabs will grant you access to nested tabs.
The first tab “Scoreboard” has nested tabs that show several lists, including “Invoices” and “Posted Payments”.
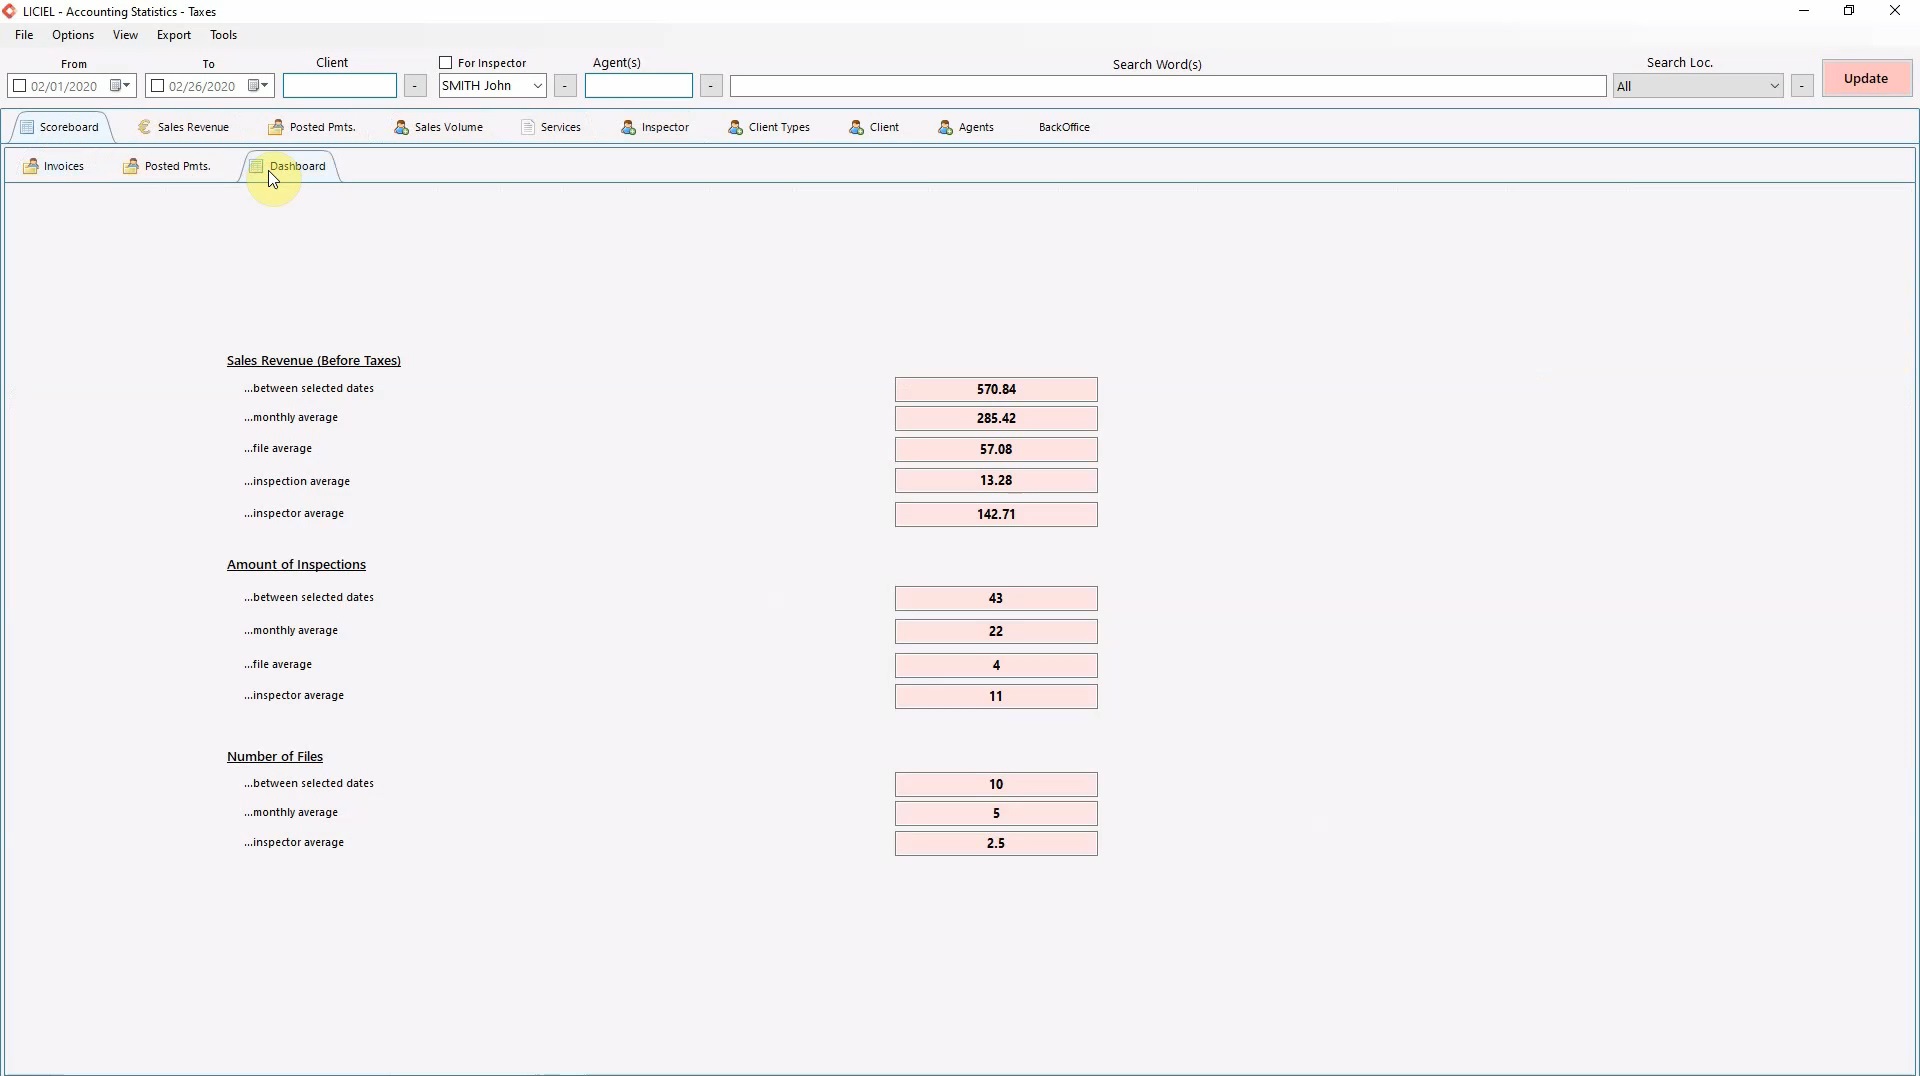
It also is home to the “Dashboard” which displays an overview of the sales revenue, amount of inspections, and the number of inspection files.
The next tabs display easy to read graphs.
Click the “Sales Revenue” tab.
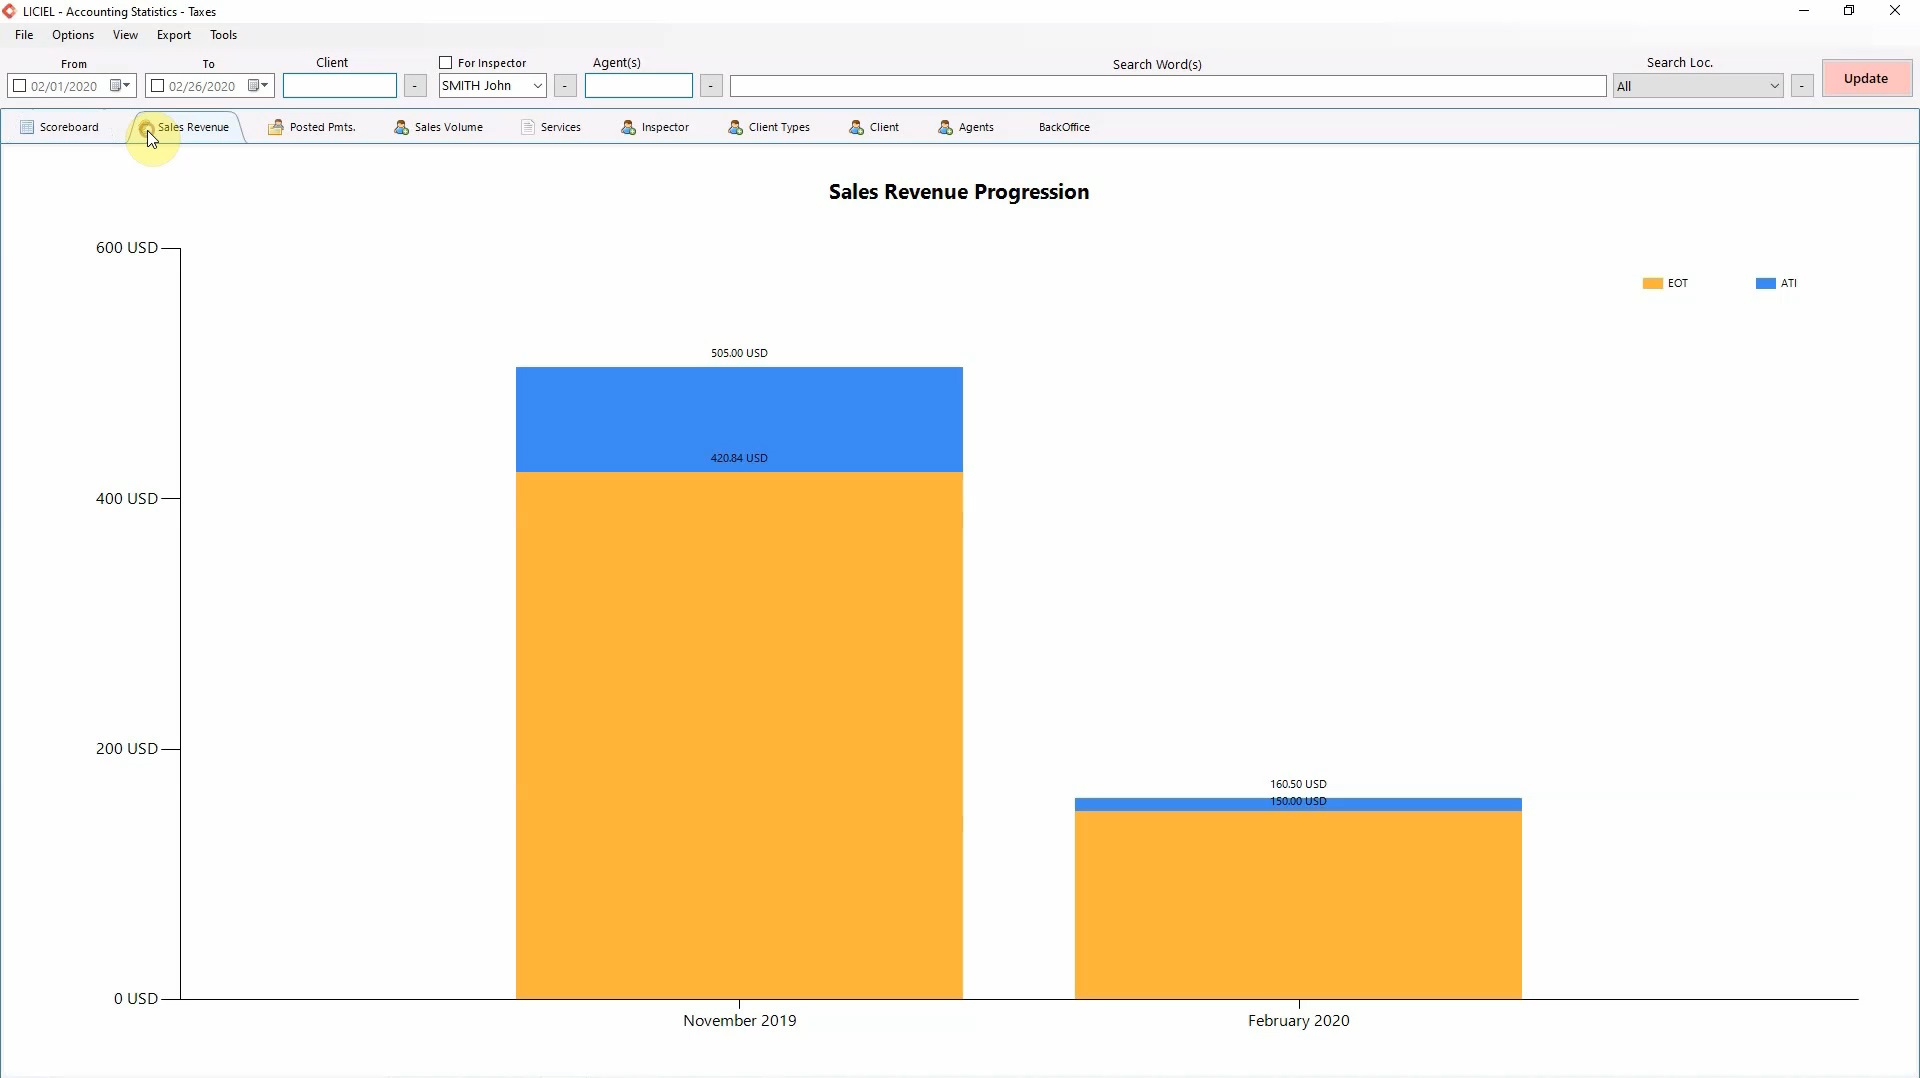
Here you will see the Sales Revenue Progression by month.
Notice that the bars have two colors.
The orange portion is the sales revenue before taxes, and the blue portion is the taxes.
Together, they form the Sales Revenue for that month.
Click the “Posted Payments” tab.
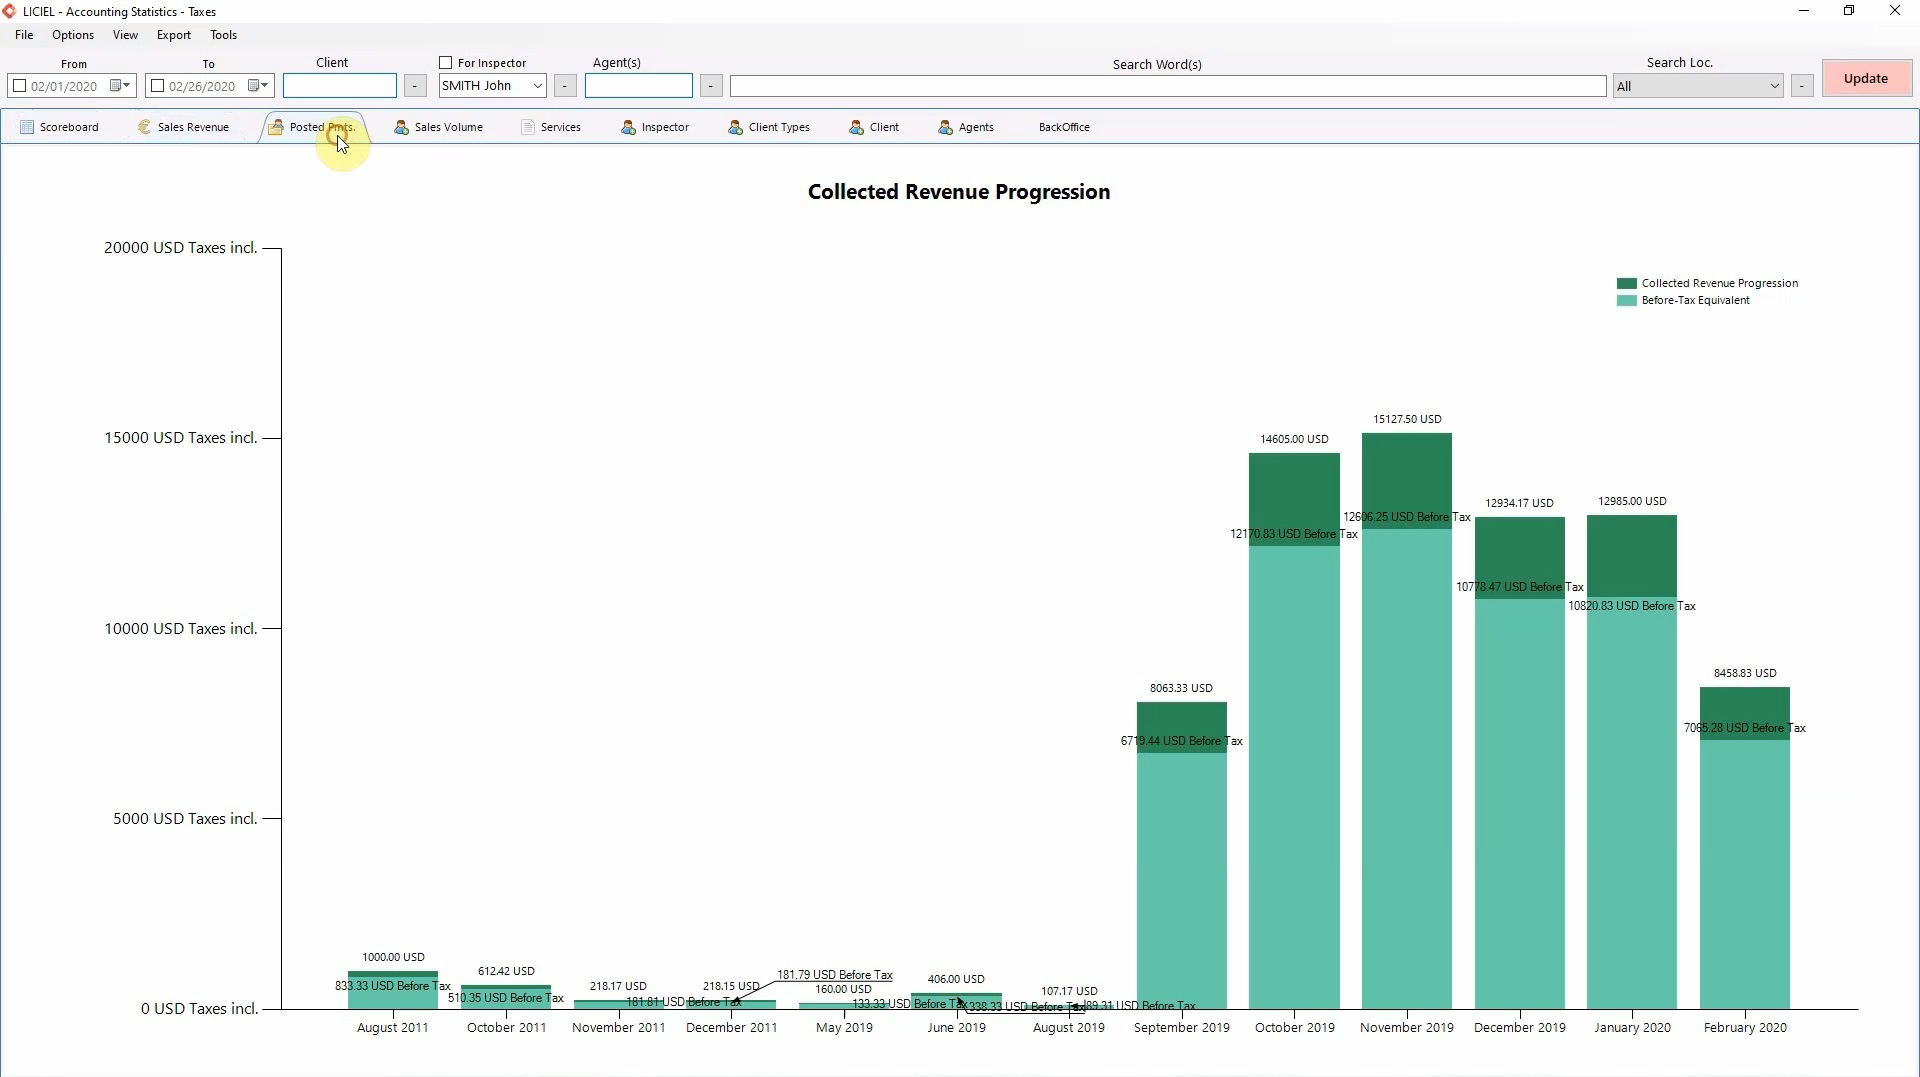
This graph shows the collected revenue using the filters applied.
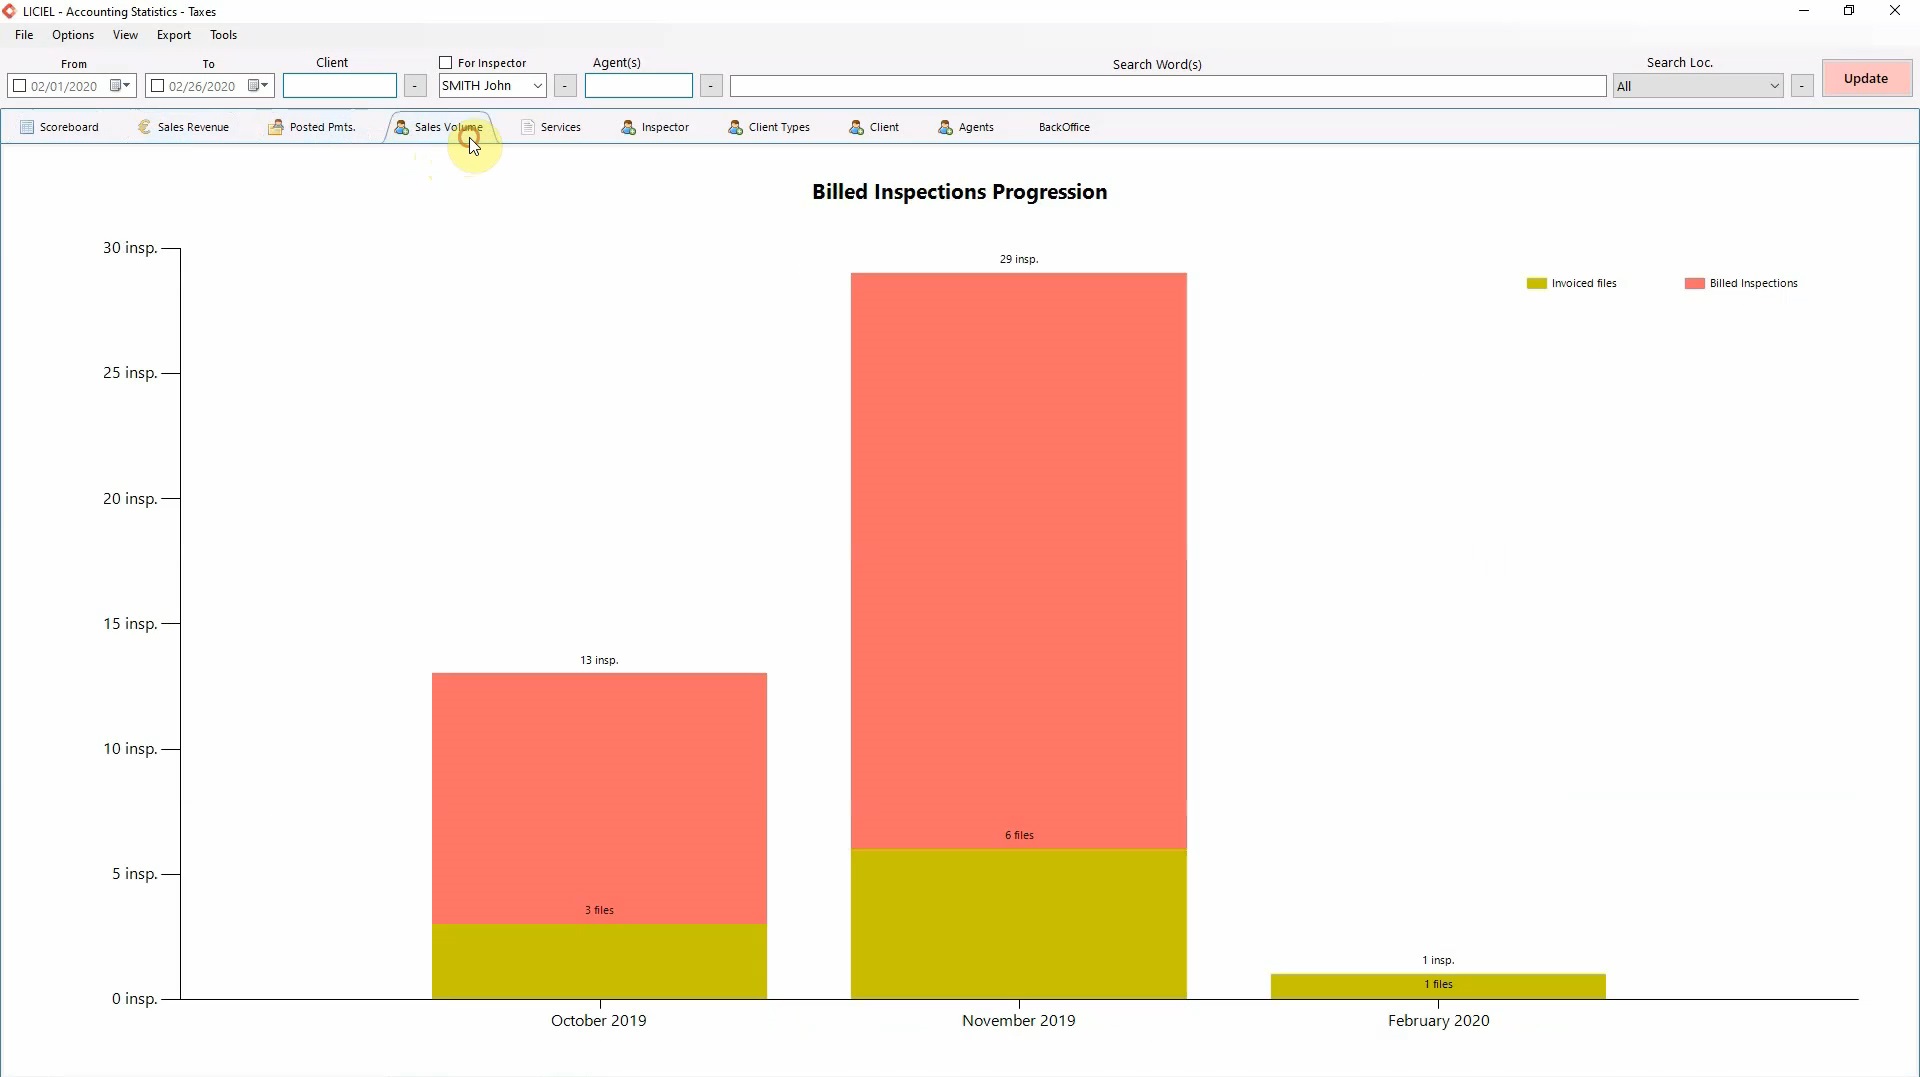
The fourth tab “Sales Volume” displays a graph of the billed inspections compared to the amount of invoiced files.
Continuing to the “Services” tab.
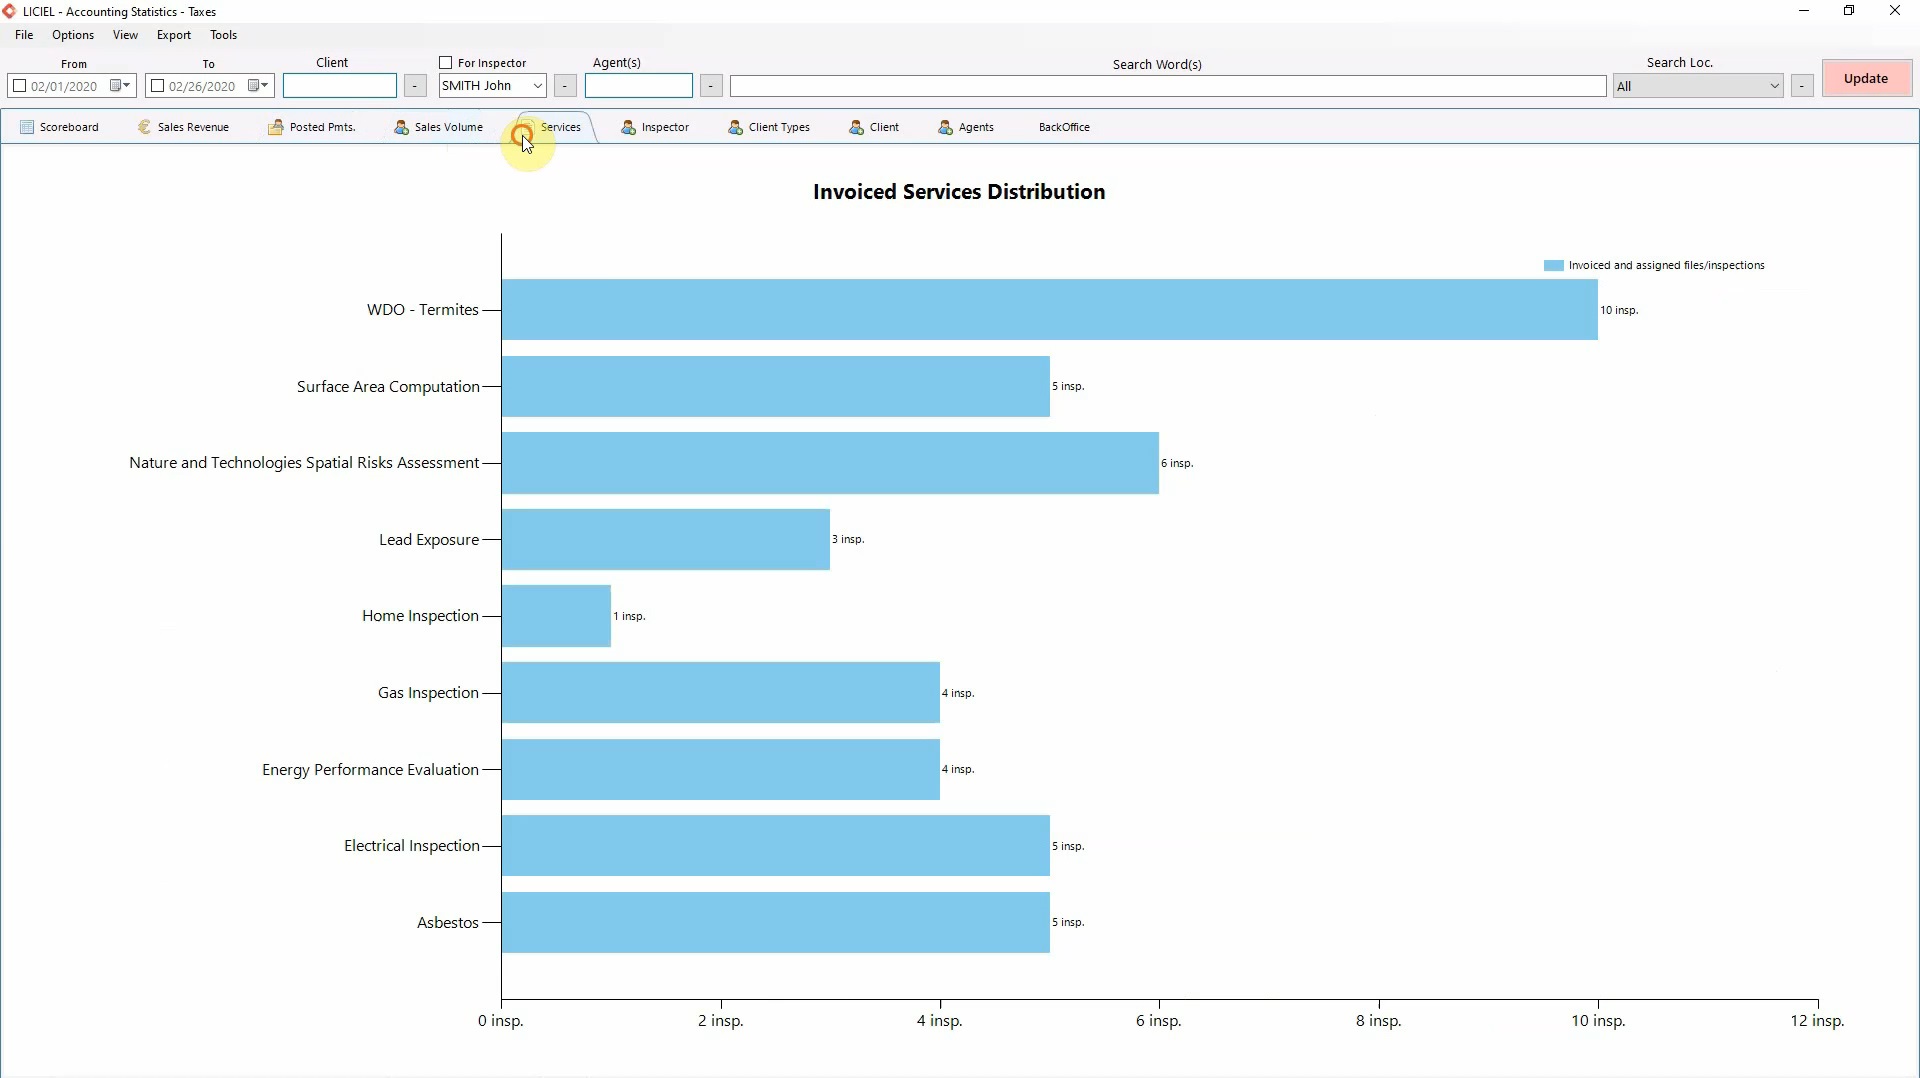
This graph details the number of each type of service provided.
The sixth tab, “Inspector”, displays the top performing inspectors with important information regarding the number of file, the amount of inspections, the sales revenue, and the collected sales revenue.
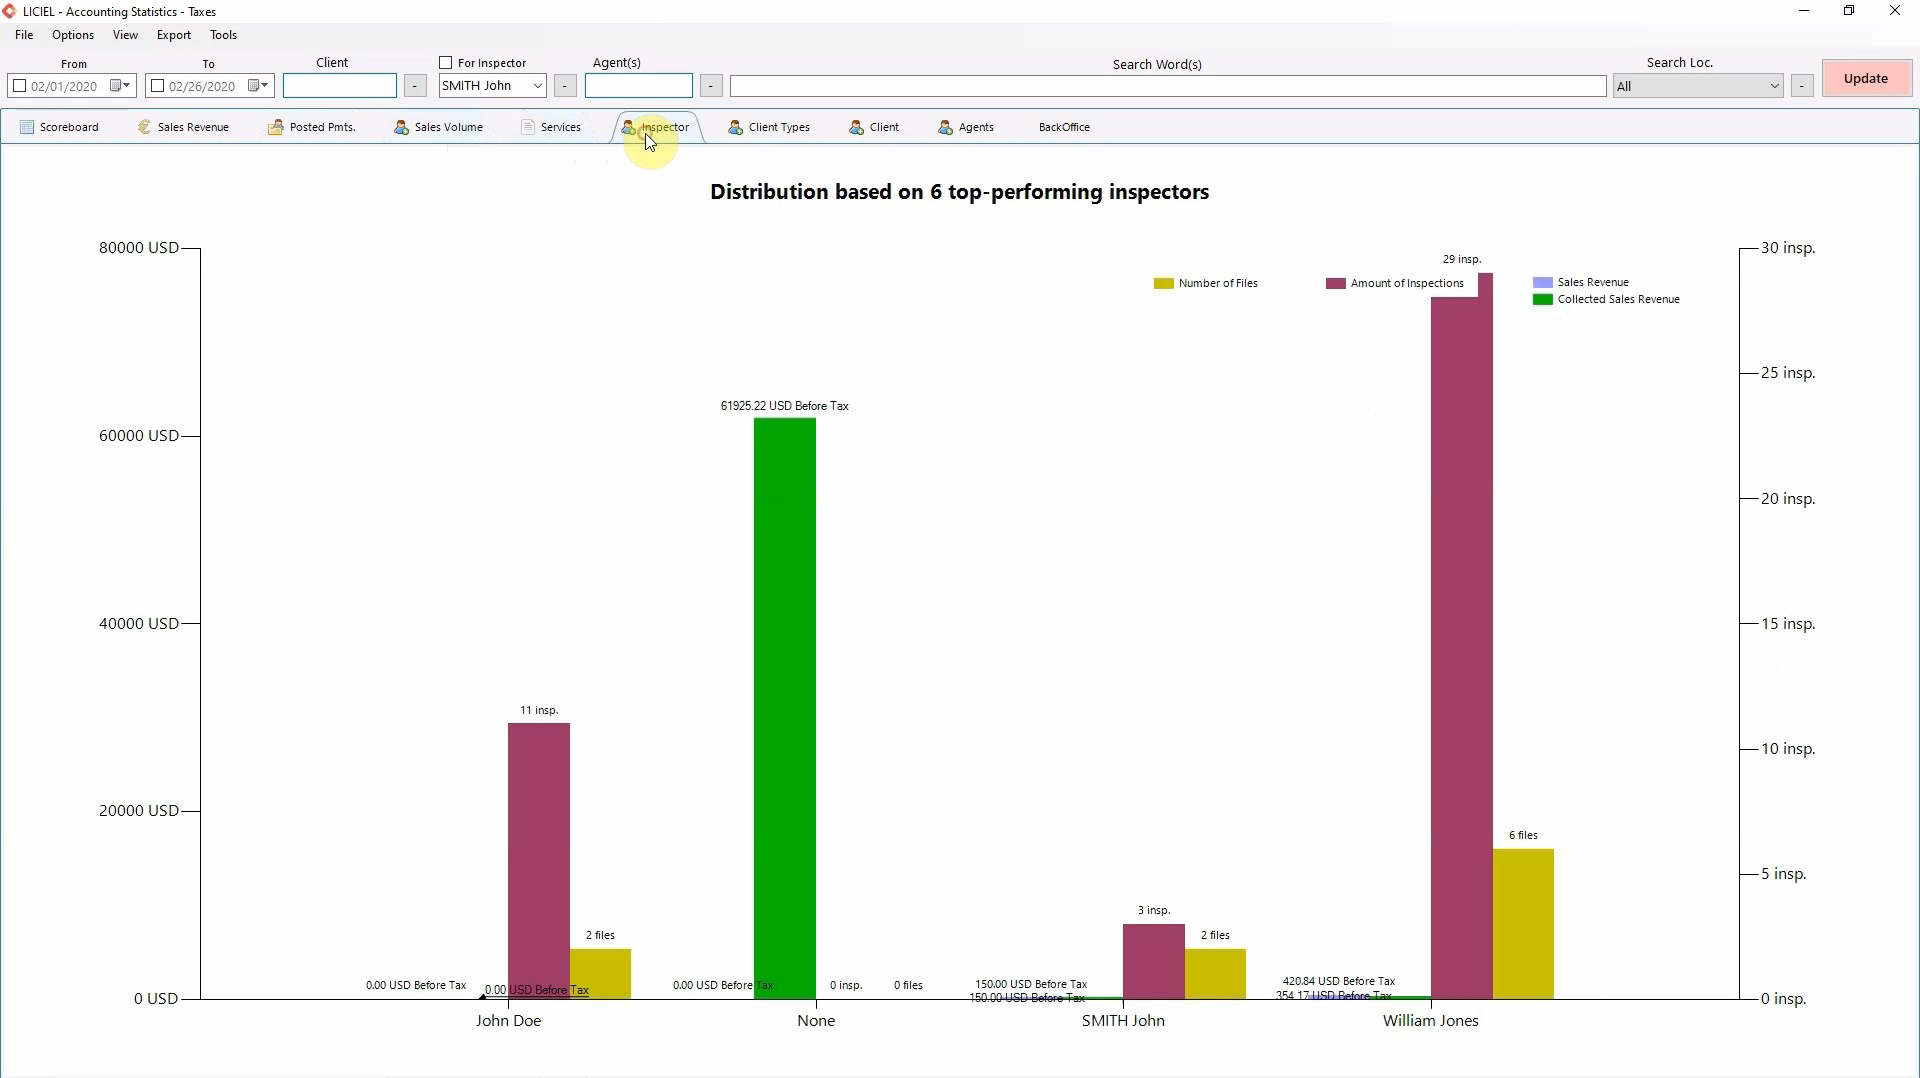
LICIEL allows you to specify how many of the top inspectors to display.
Click “View” from the tool bar, hover over “Display First”.
Then, enter the number of your choosing.

Click “Update” to update the graphs.
Click on the “Client Types” tab.
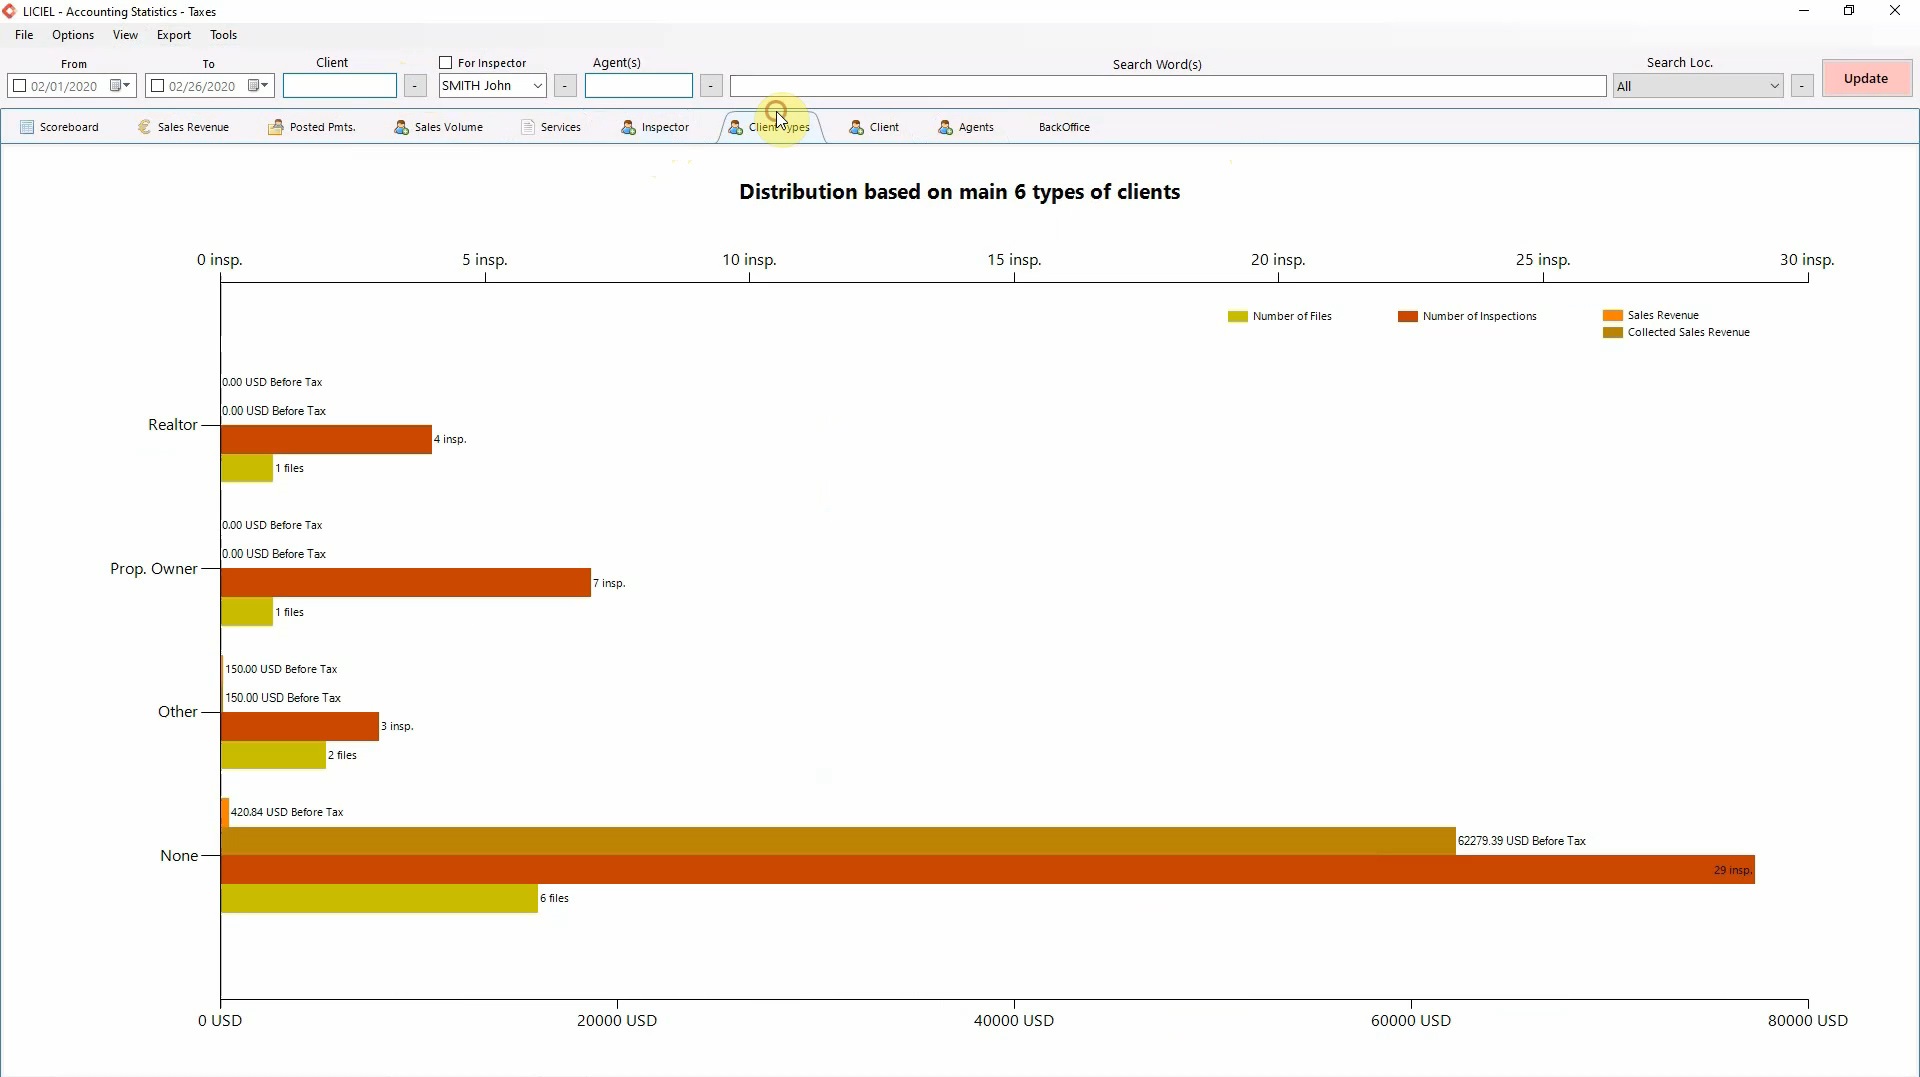
This graph shows which types of clients are requesting your services and how much revenue that type of client pulls in.
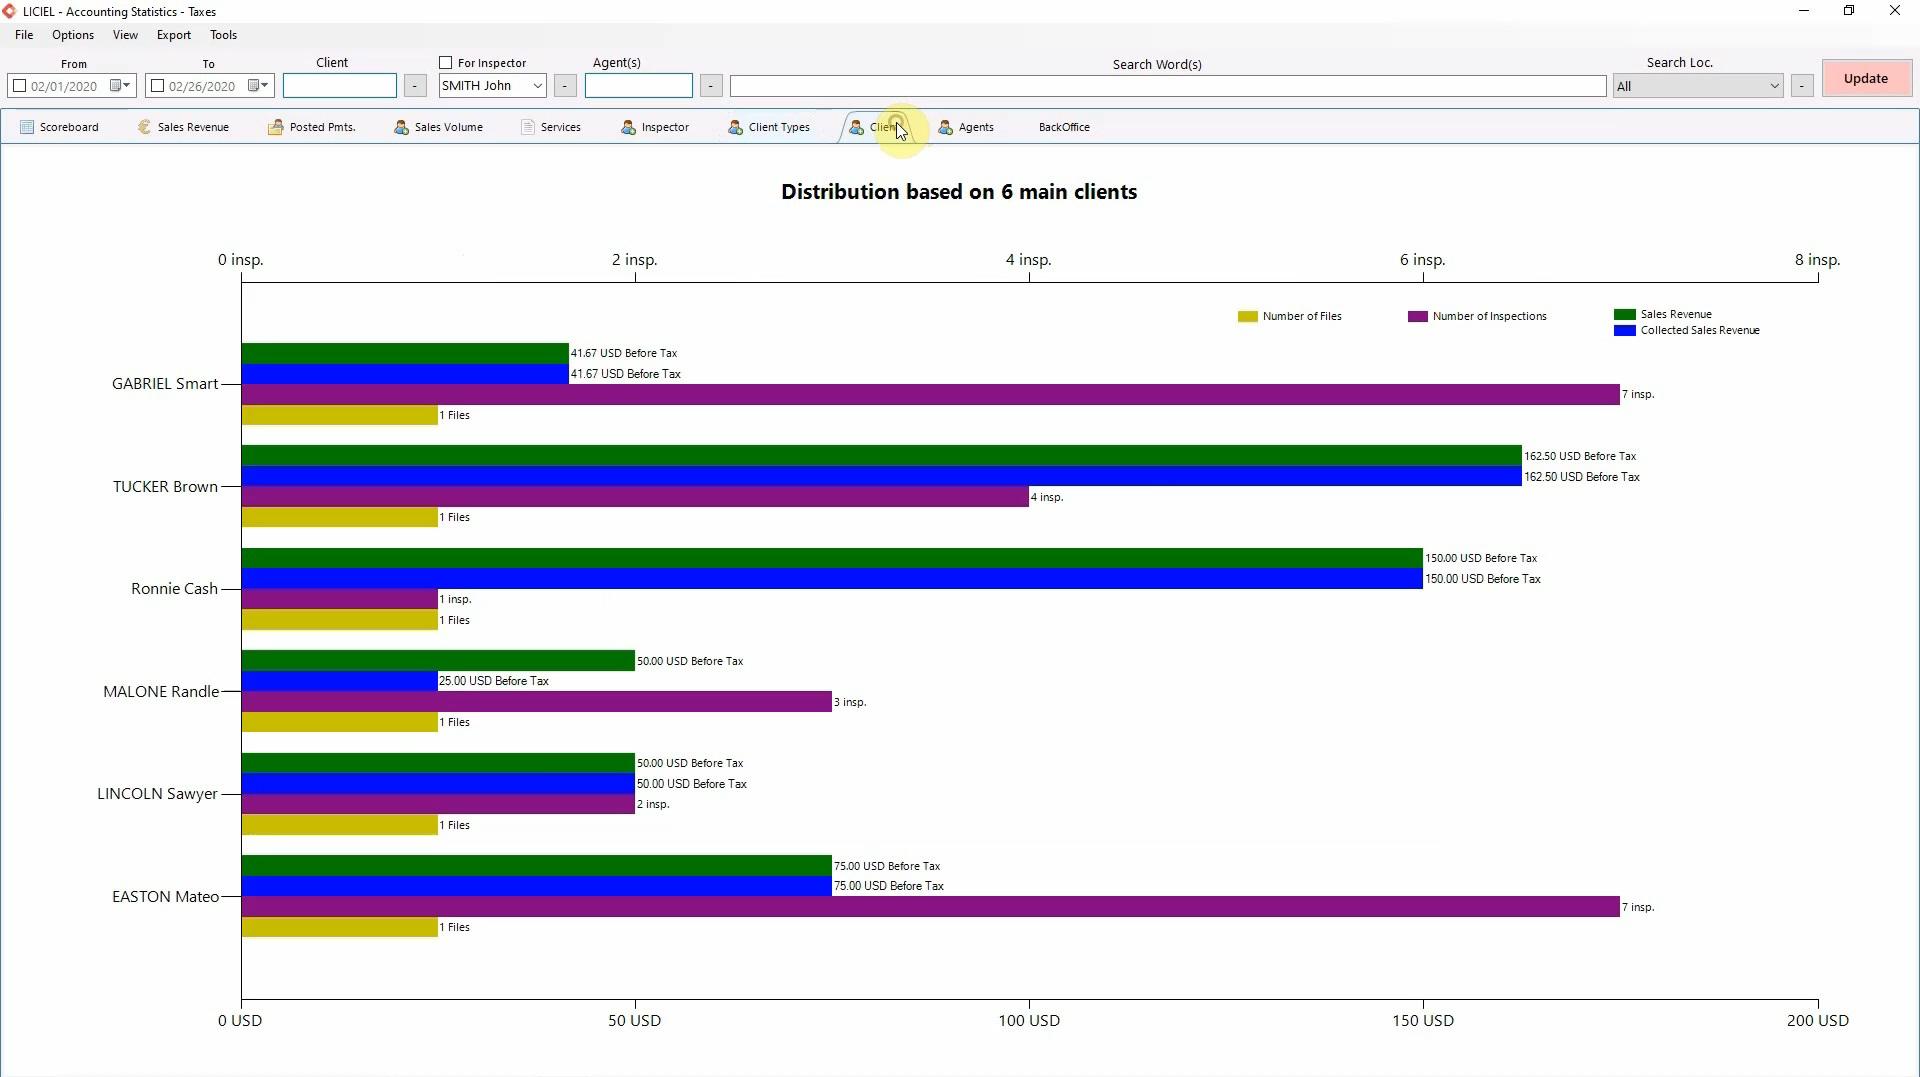
The 8th tab “Client” shows your top clients and their revenue.
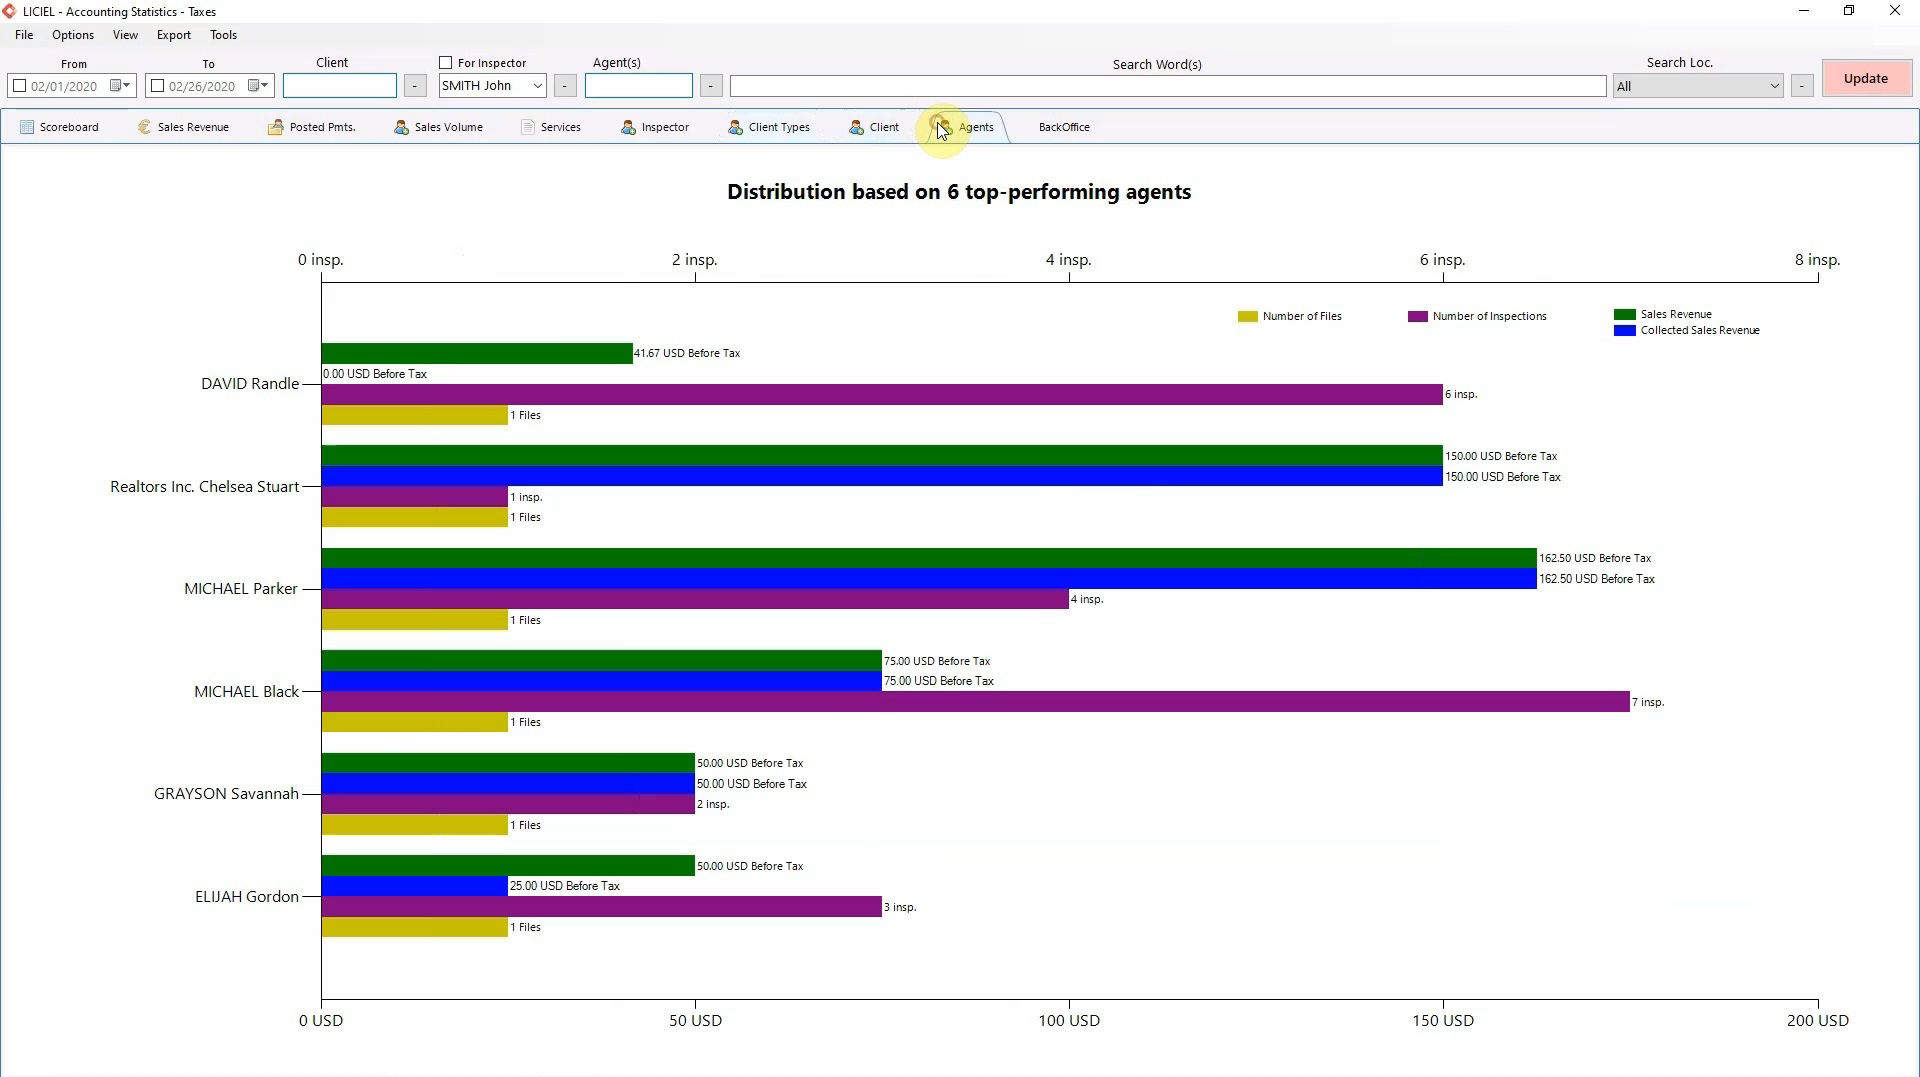
The “Agents” tab displays the top agents and their revenue.
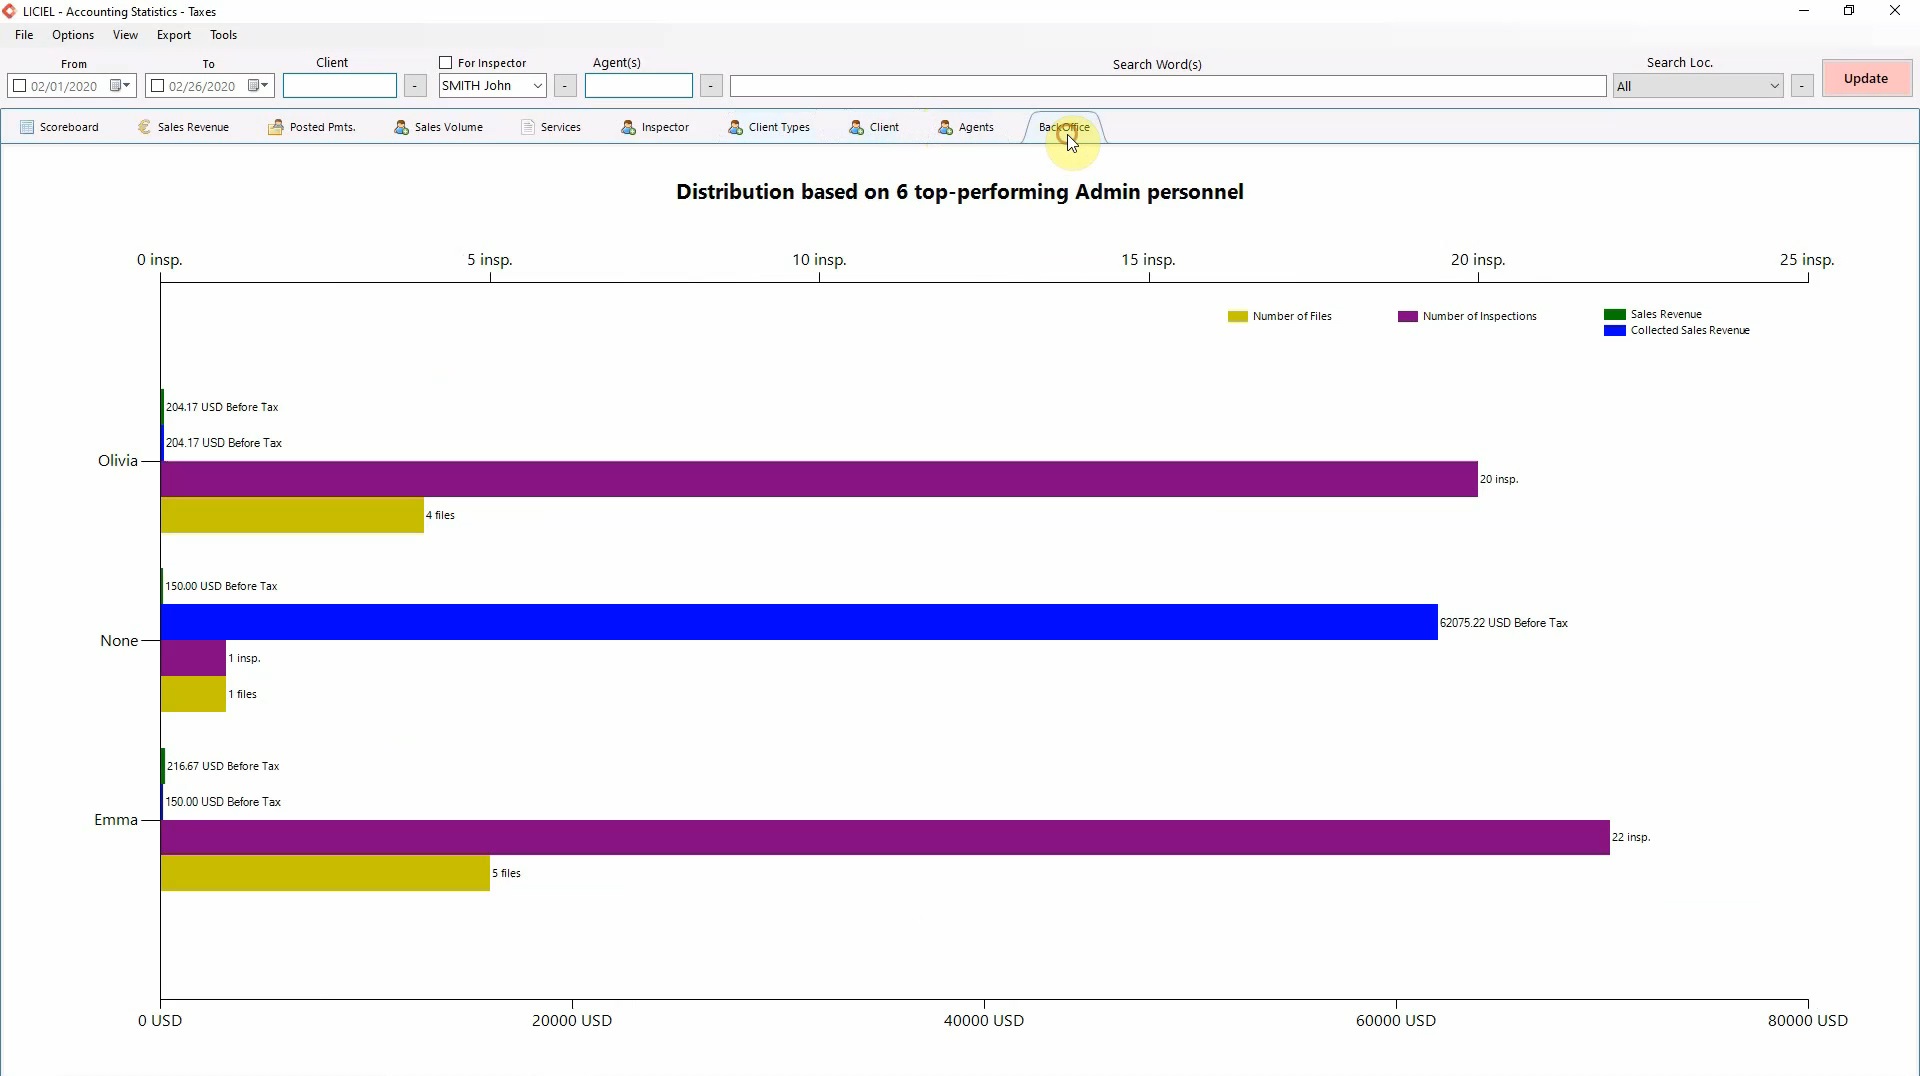
The very last tab “BackOffice” specifies the number of files, inspections, and the revenue pertaining to your admin personnel.
Close the “Accounting Statistics - Taxes” window.
III. Glossaries
LICIEL offers two glossaries for your convenience.
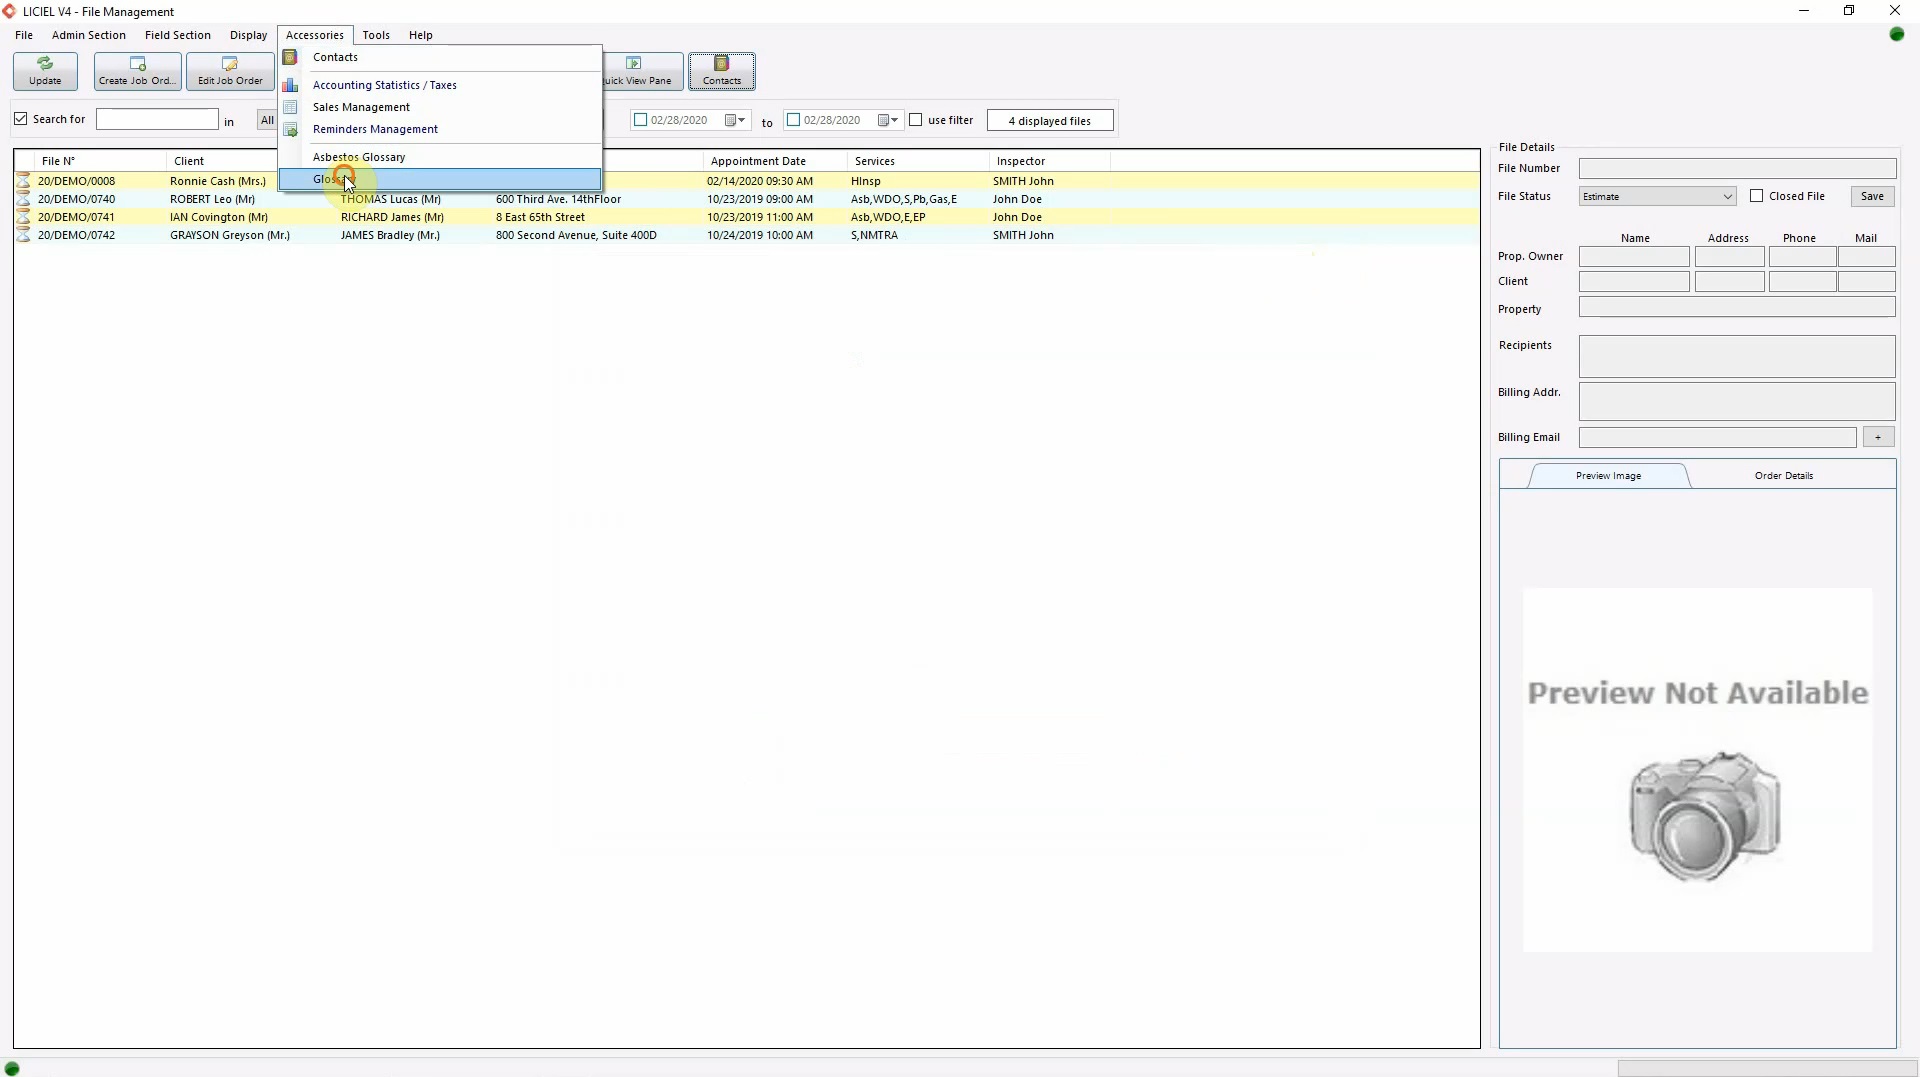
Click “Accessories” from the toolbar and select “Asbestos Glossary”.
Use the house map to select an area of the house or click on an area from the list on the left.
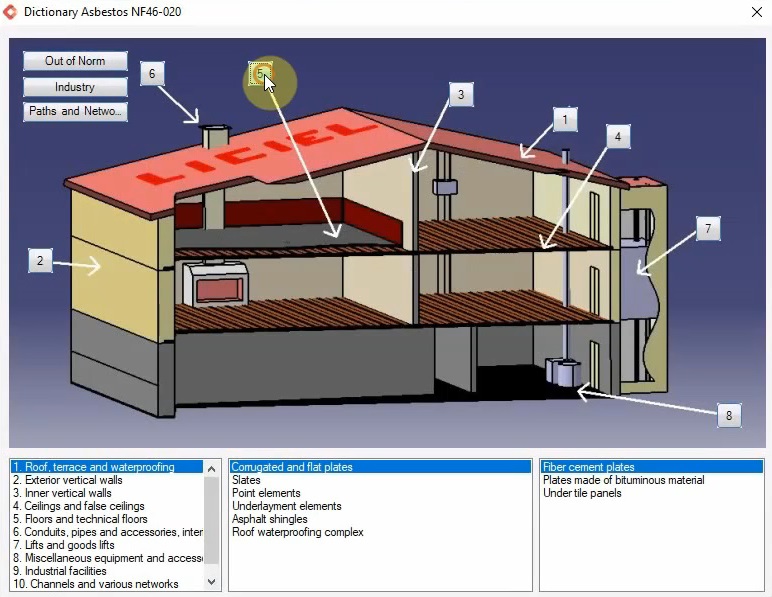
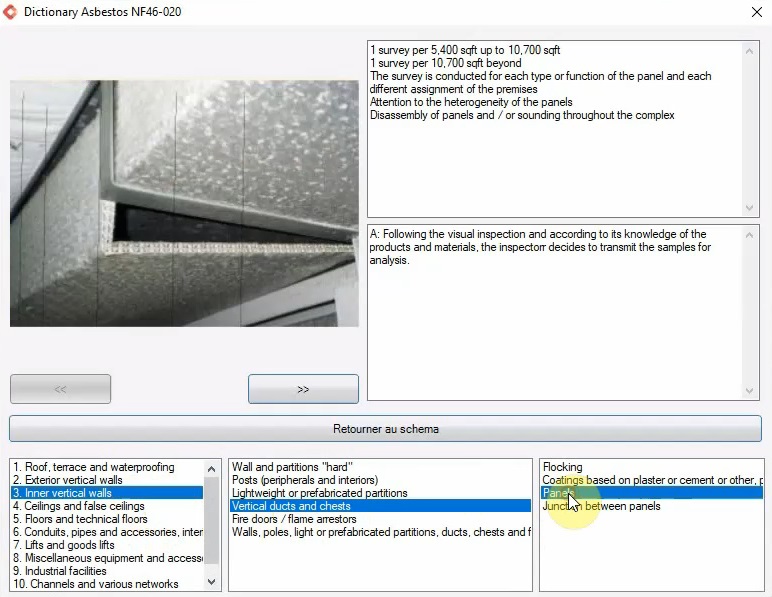
Navigate through the boxes from left to right.
Double click on any item on the right-most box to read the suggested instructions for sampling.
Close the asbestos glossary.
Click “Accessories” from the toolbar and select “Glossary”.
Here you can view definitions for some commonly used words in the home inspection field.
Select an item from the list to view the definition.
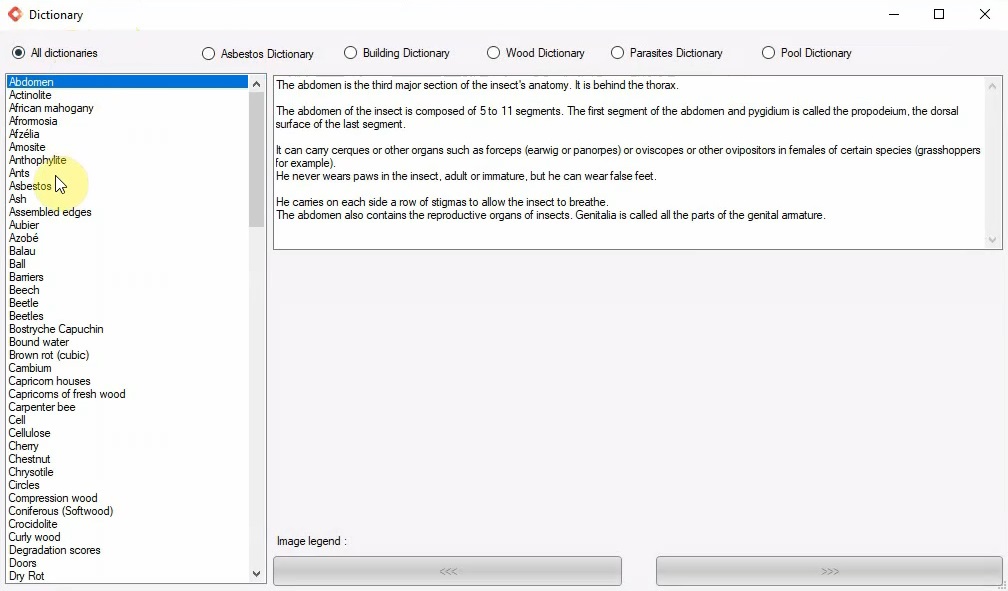
Close the glossary window.
III. WikiLICIEL
LICIEL offers several tools to help you generate the best reports.
Check out our Wiki Articles on WikiLICIEL for step by step support.
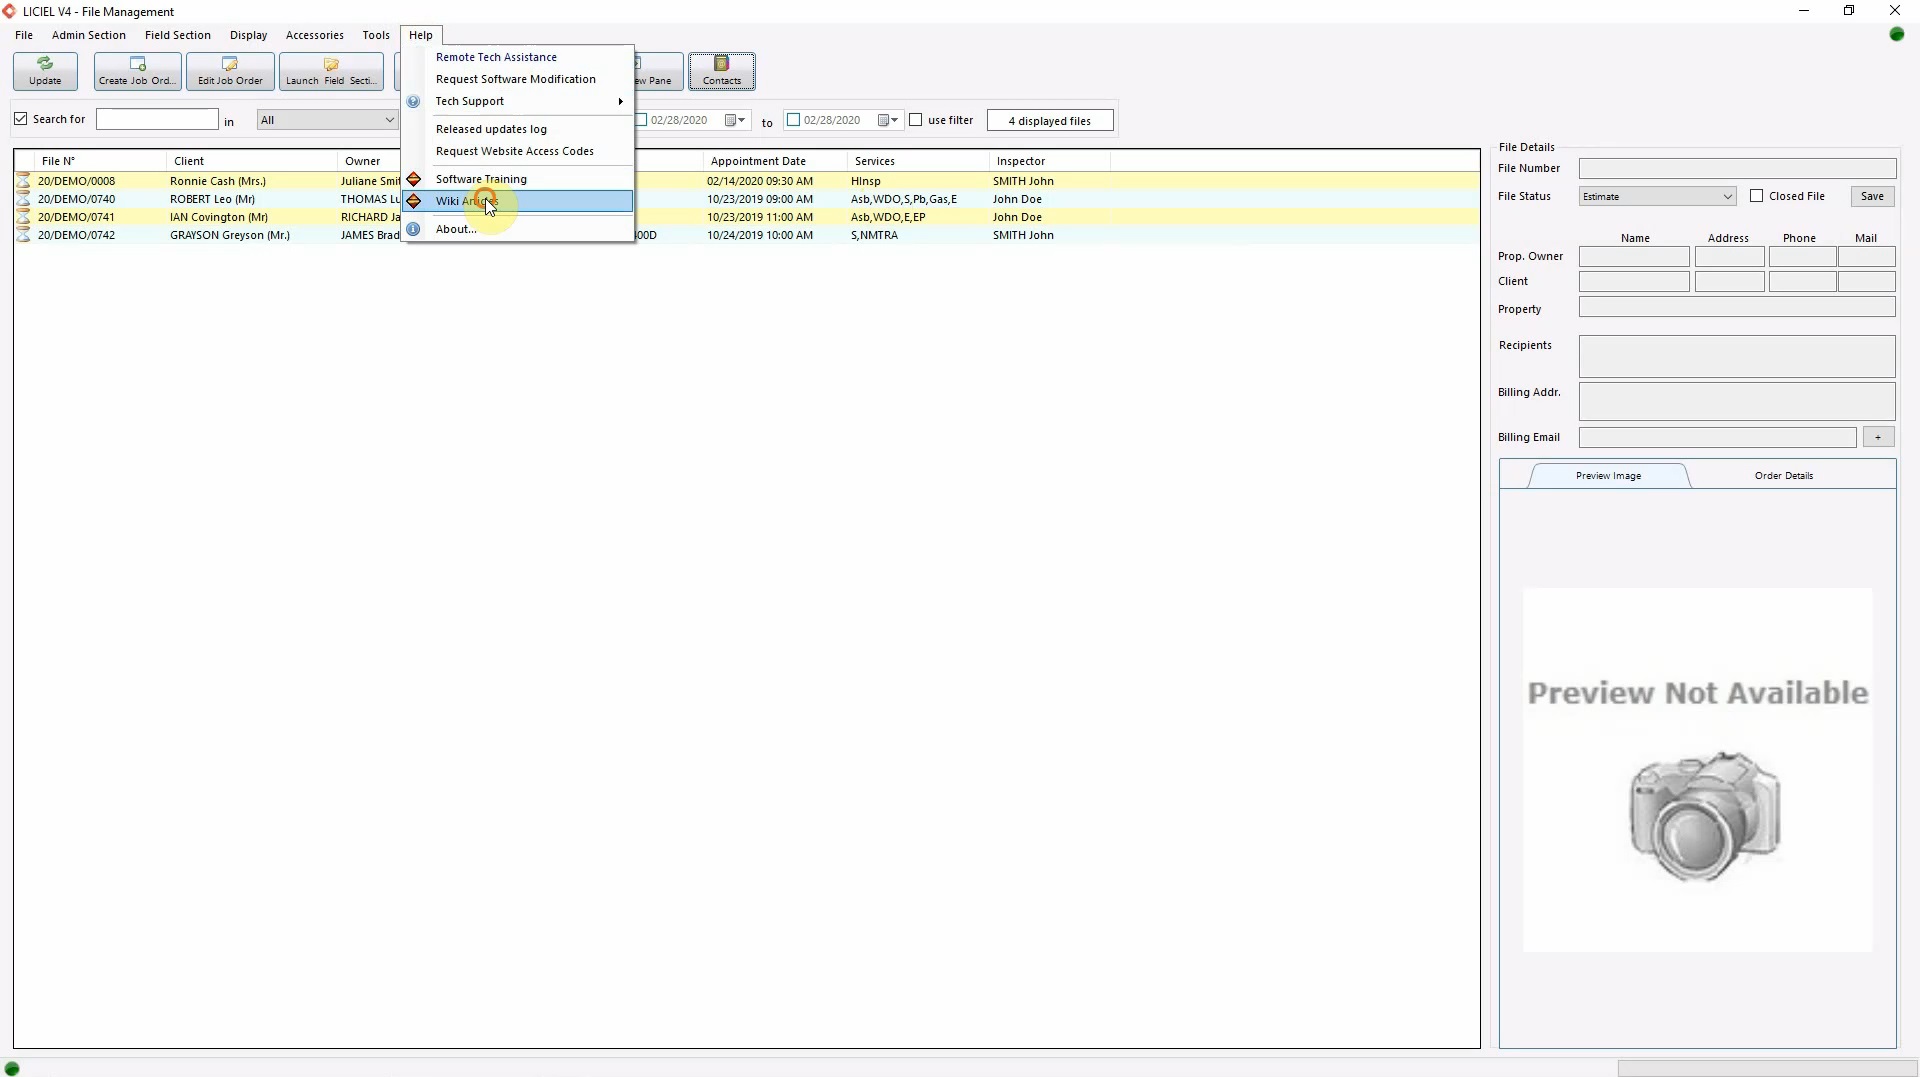
Click “Help” in the toolbar and select "Wiki Articles", or open a web browser and go to WikiLICIEL.
Navigate through the list of articles using the arrows or search for an article by using the search box.
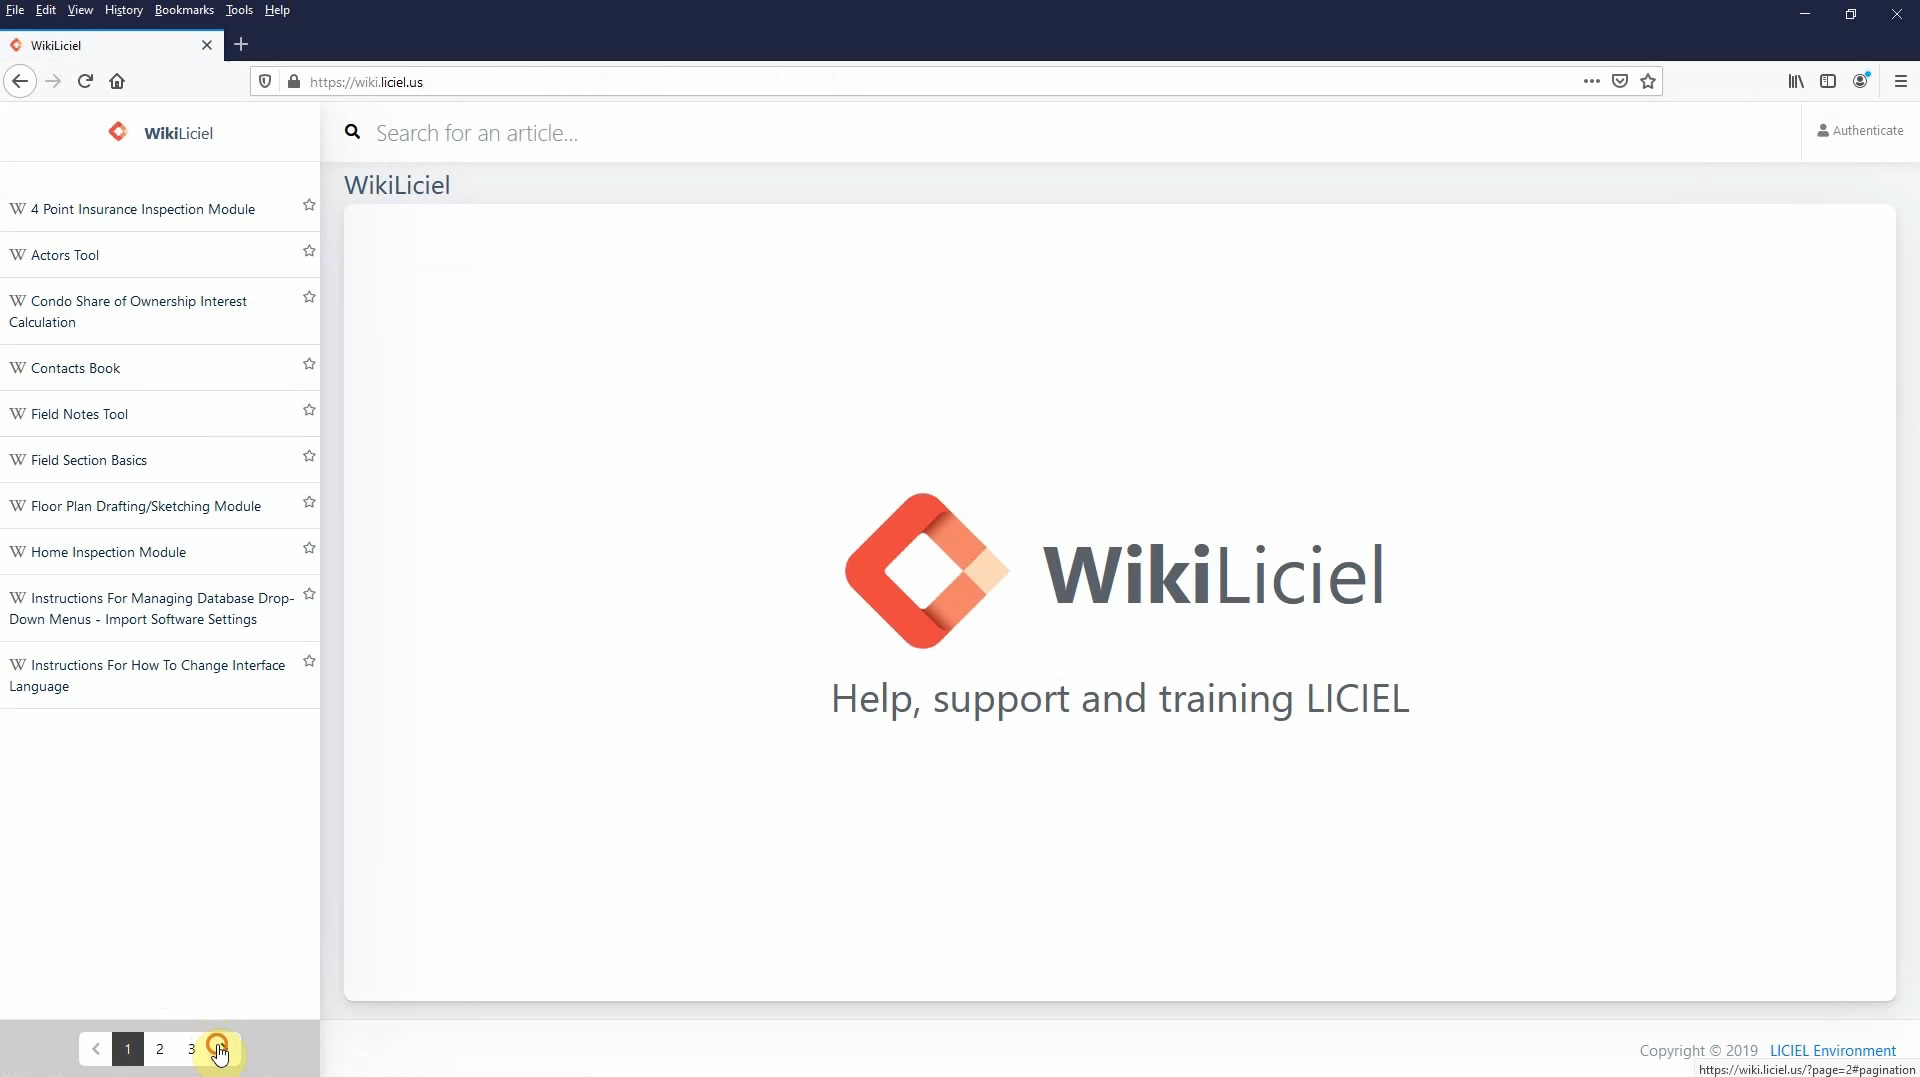
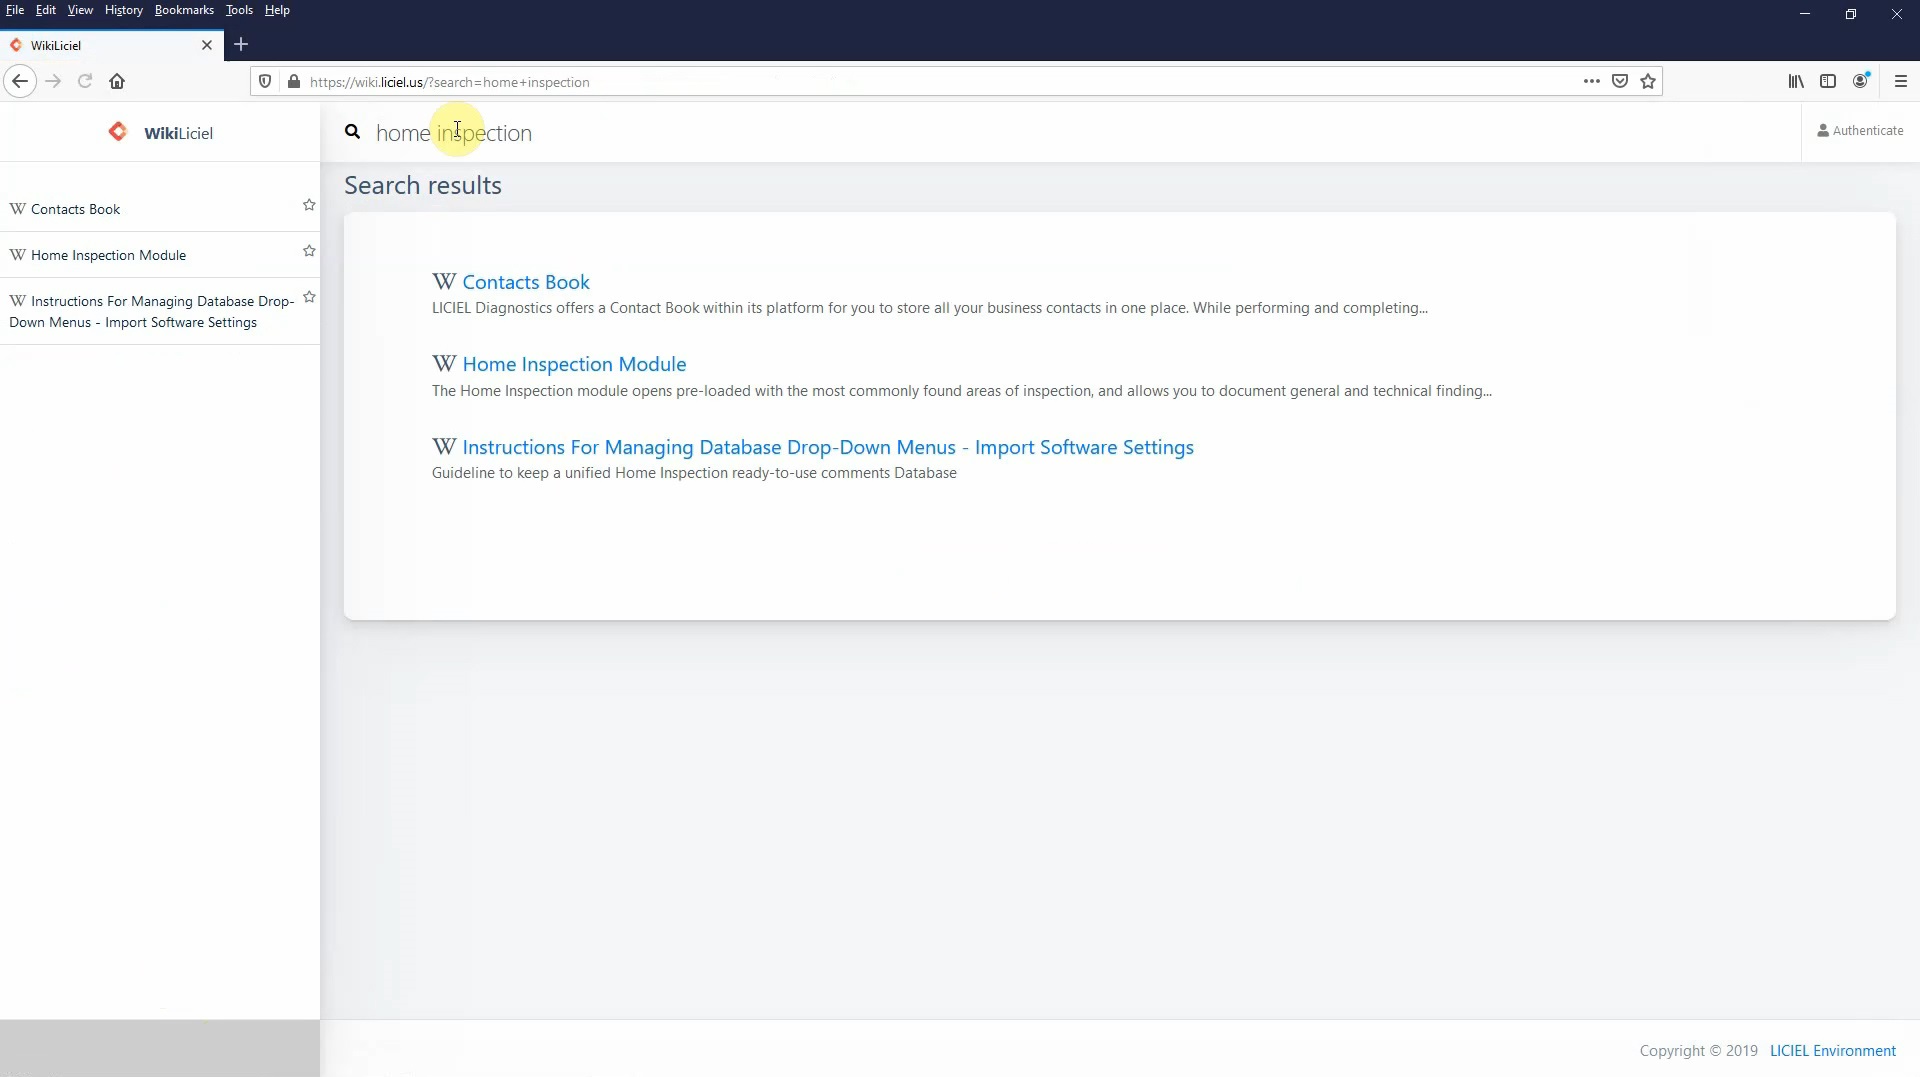
Click on an article to view it.
Close WikiLICIEL.
IV. Contact Us
Beyond the Wiki Articles, the LICIEL training team is here to support you through all of your inspections.
Go to our website: Liciel.us
Click “Contact Us”.
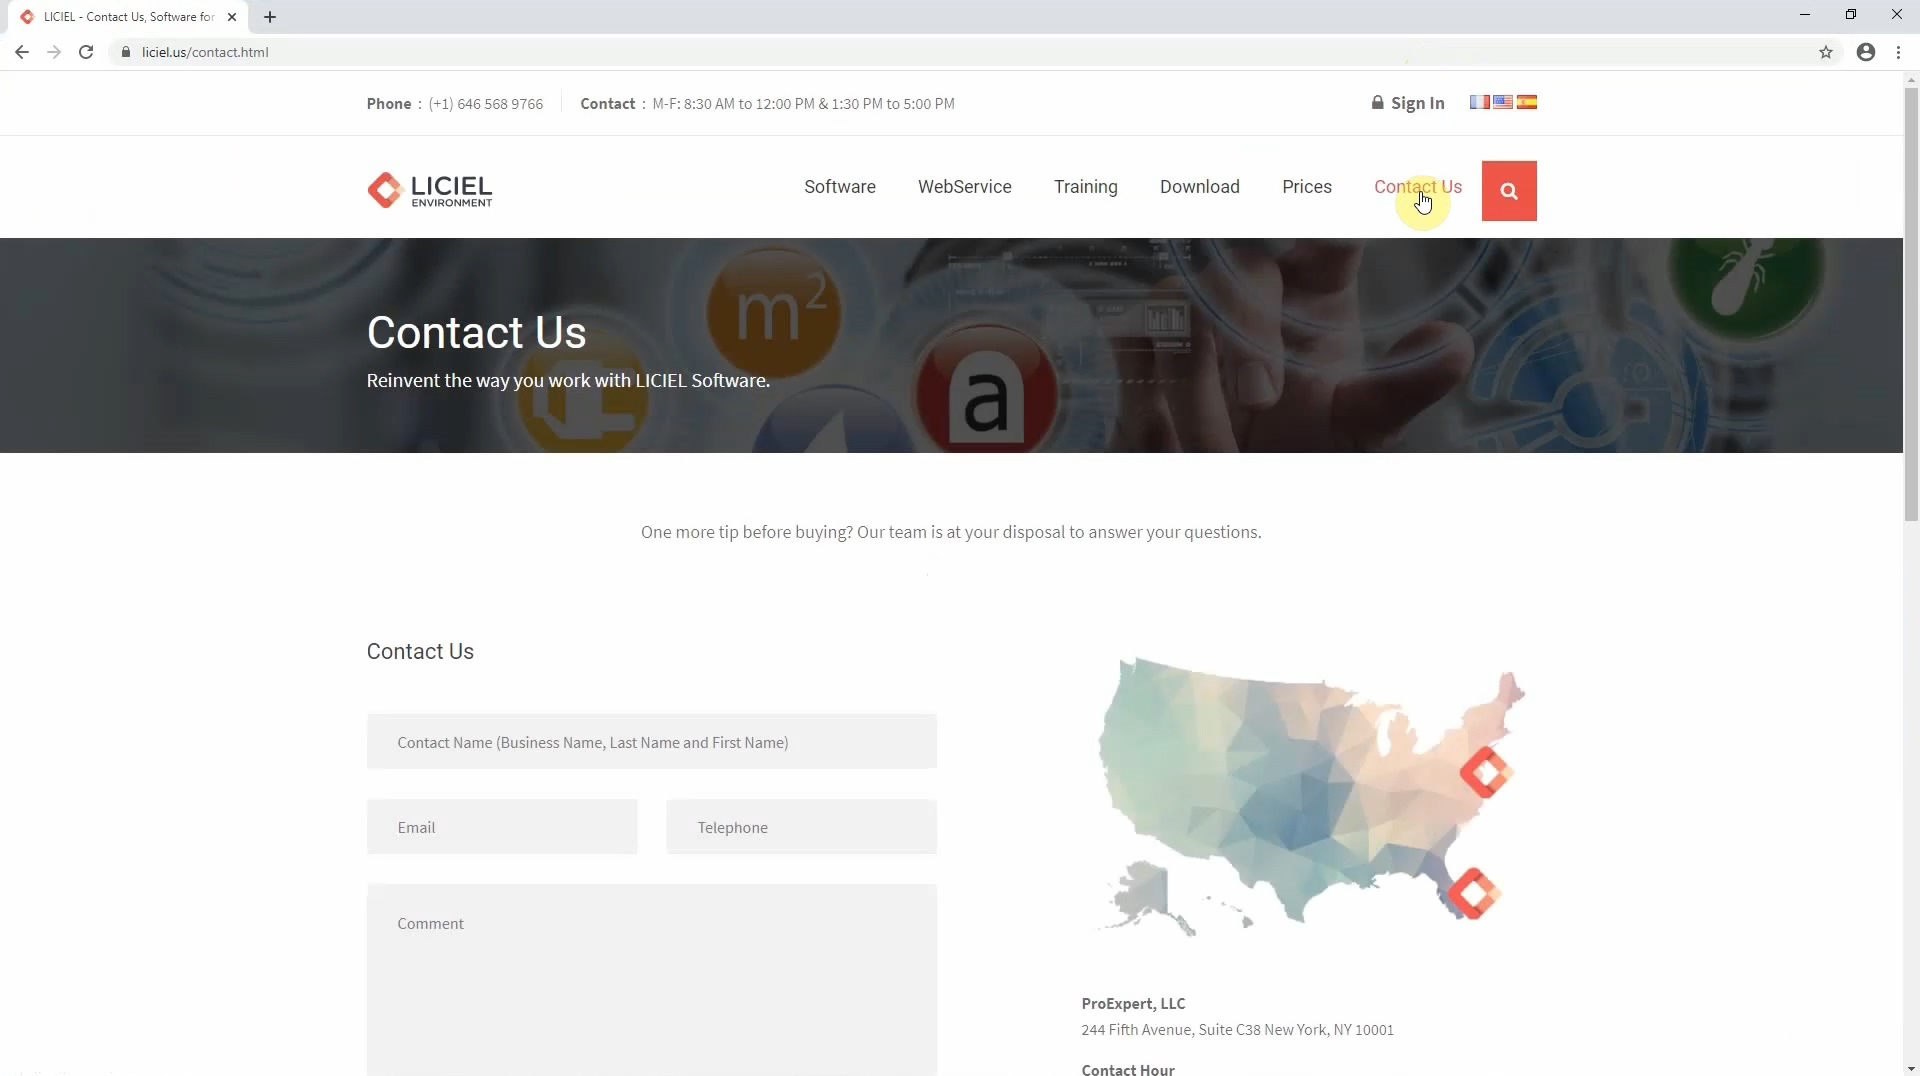
Use our contact information on the side or fill out the contact form.
V. Remote Technical Assistance
Once we are in contact, we can provide assistance.
If needed, we can connect to your computer using TeamViewer.
To do this, go to the LICIEL Inspection Software.
Click “Help” from the tool bar and select “Remote Tech Assistance”.
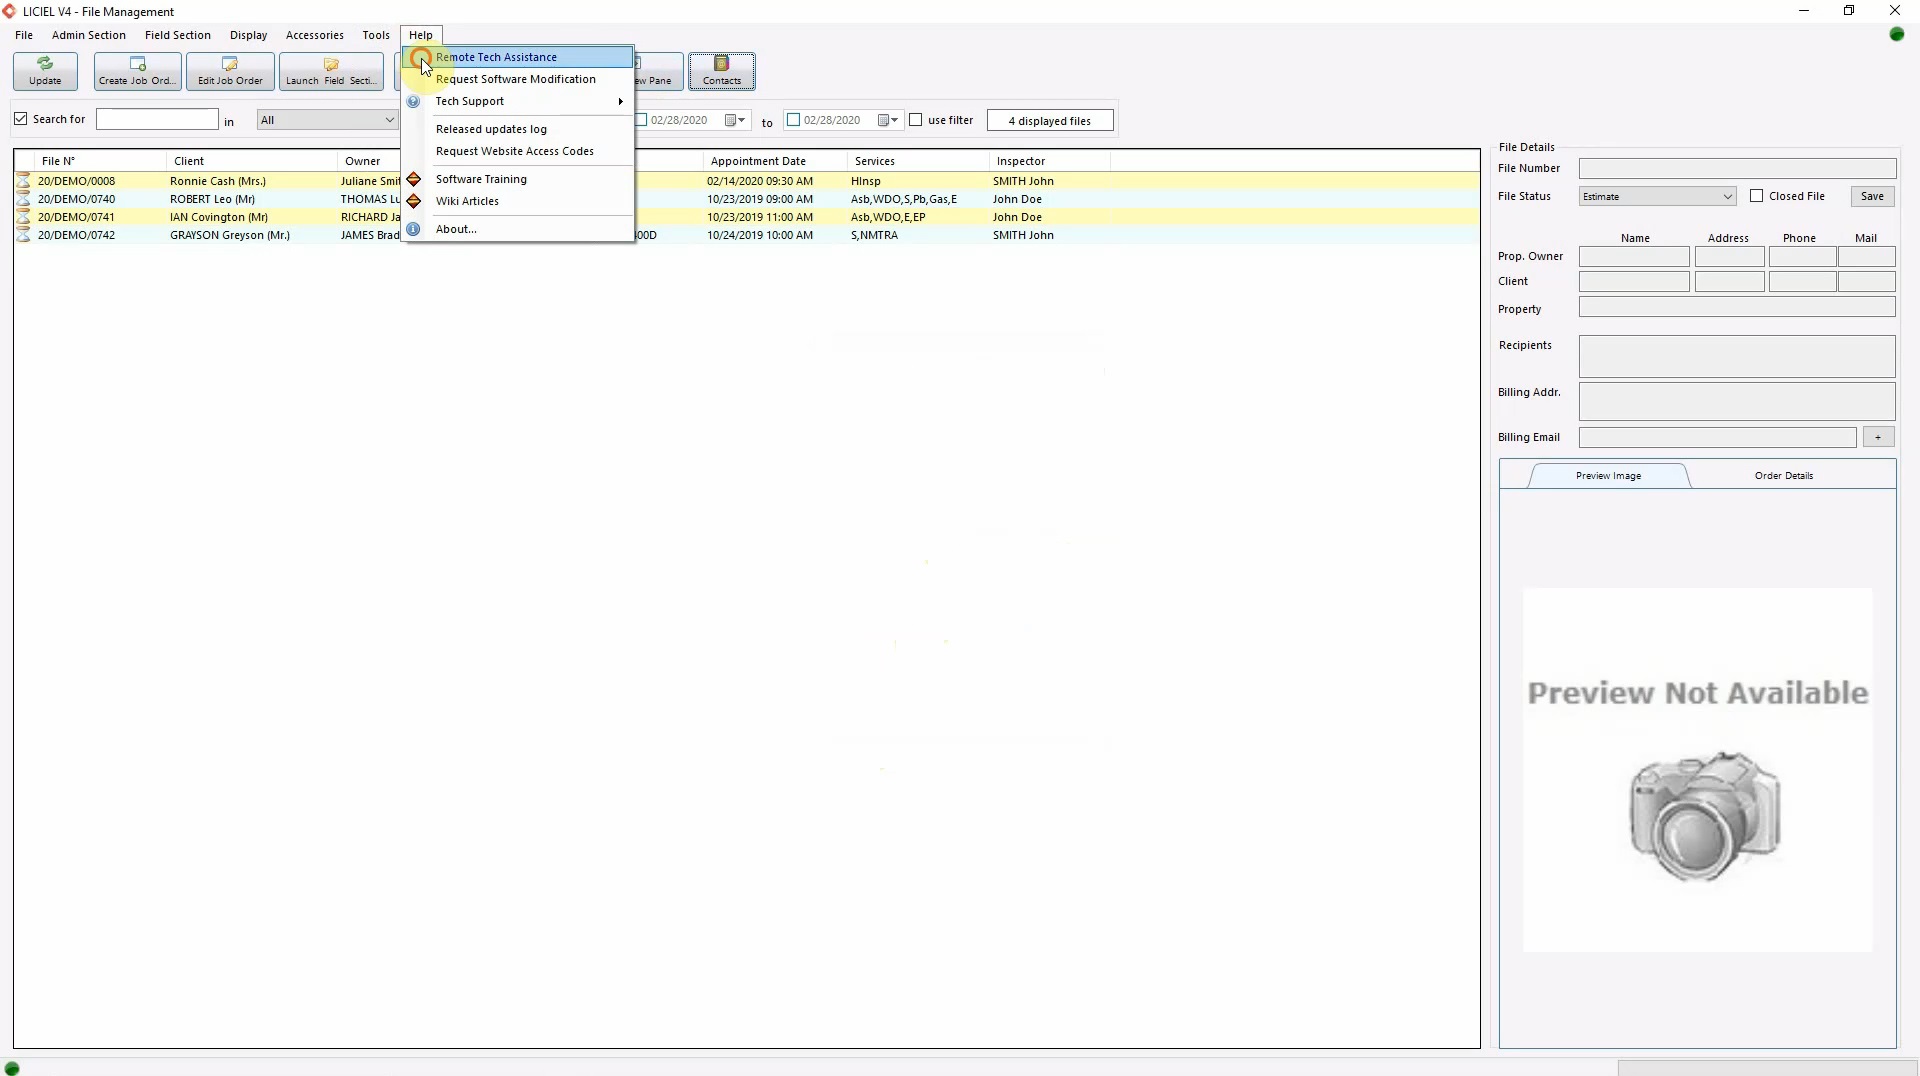
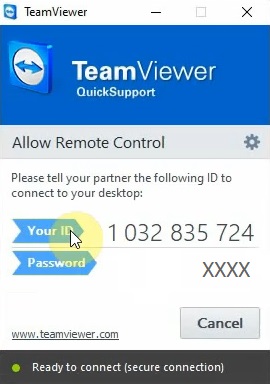
This will open the TeamViewer popup with the information needed to help us connect.
Using the remote control id and password, we can view your screen and assist you in real time.
With LICIEL, you can rest assured that there will always be someone to assist you!